Stomata Lab 3c4154
This document was ed by and they confirmed that they have the permission to share it. If you are author or own the copyright of this book, please report to us by using this report form. Report r6l17
Overview 4q3b3c
& View Stomata Lab as PDF for free.
More details 26j3b
- Words: 2,033
- Pages: 7
THE EFFECT OF DIFFERING LEAF HEIGHTS IN PINUS SP. ON STOMATAL DENSITY ALAN MO James Madison University
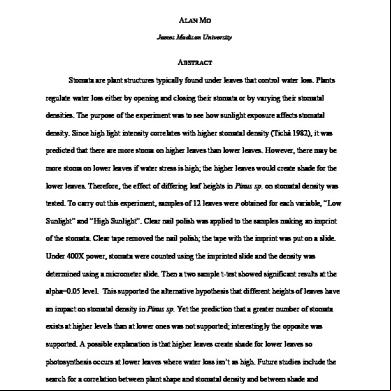
ABSTRACT Stomata are plant structures typically found under leaves that control water loss. Plants regulate water loss either by opening and closing their stomata or by varying their stomatal densities. The purpose of the experiment was to see how sunlight exposure affects stomatal density. Since high light intensity correlates with higher stomatal density (Tichà 1982), it was predicted that there are more stoma on higher leaves than lower leaves. However, there may be more stoma on lower leaves if water stress is high; the higher leaves would create shade for the lower leaves. Therefore, the effect of differing leaf heights in Pinus sp. on stomatal density was tested. To carry out this experiment, samples of 12 leaves were obtained for each variable, “Low Sunlight” and “High Sunlight”. Clear nail polish was applied to the samples making an imprint of the stomata. Clear tape removed the nail polish; the tape with the imprint was put on a slide. Under 400X power, stomata were counted using the imprinted slide and the density was determined using a micrometer slide. Then a two sample t-test showed significant results at the alpha=0.05 level. This ed the alternative hypothesis that different heights of leaves have an impact on stomatal density in Pinus sp. Yet the prediction that a greater number of stomata exists at higher levels than at lower ones was not ed; interestingly the opposite was ed. A possible explanation is that higher leaves create shade for lower leaves so photosynthesis occurs at lower leaves where water loss isn’t as high. Future studies include the search for a correlation between plant shape and stomatal density and between shade and stomatal density.
INTRODUCTION Stomata play an essential role in all plants. These openings allow for gas exchange and water flow throughout plants. Gas exchange occurs when carbon dioxide molecules enter the leaves for photosynthesis and when excess oxygen molecules leave the leaves. The pores allow for water flow throughout plants by creating a lower water pressure at the leaves than at the roots. Since water will move from an area of greater water pressure to one of lower water pressure, the sun’s induced water evaporation from the plants’ stomata will allow water to flow from the roots, to the shoots, and finally to the leaves. Also, this process of water evaporation is analogous to humans sweating, cooling down a plant when temperatures are high to protect enzymes and cells from overheating. But if stomata are left open, too much water can evaporate leading to desiccation. Thus, stomata can open and close throughout the day to control water loss. In addition to regulating water loss through the opening and closing of stomata, plants can vary the stomatal density. Greater stomatal density results in the more efficient control over water loss. Consequently, one would expect to find greater stomatal density in regions of high water loss. Because the amount of sunlight exposure directly correlates with water loss, greater stomatal density is expected to be in areas of greater sunlight exposure (Tichà 1982). In one situation, it is predicted that there is more need for water control in upper regions of a plant than in the lower regions because the upper regions receive more sunlight. Yet this may not be the case in areas where water stress is high. For instance, a plant living in a water-stressed environment may rarely open its stomata in the upper regions and instead open them in the lower regions where the sunlight isn’t as intense. Therefore it is logical that the plant have more stomata where it is
opening them the most, the lower regions in this case. With respect to the inconsistency of stomata densities, we question how sunlight exposure affects the stomatal density. Plants can vary in stomatal density and distribution during development which shows their resilience to environmental changes (Hetherington, Woodward, 2003). Because high light intensity correlates with higher stomatal density (Tichà 1982), the following were predicted. First, leaves at the top of the plant have more stomata than those at bottom. Second, leaves on the outer part of a plant have more stomata than those on the inner part. Third, leaves facing the south have greater stomatal density than those facing the north. Fourth, leaves in the shade have fewer stomata than those in the light. Finally, leaves of plants near water have fewer stomata than those in drier areas. In this experiment, the effect of differing leaf heights in Pinus sp. was examined to see if there would be an effect on stomatal density. The null hypothesis would be that the effect of differing leaf height in Pinus sp. does not have an effect on stomatal density. It was predicted that leaves collected in the upper tiers (high sunlight) of a tree would have more stomata than those at the lower tiers (low sunlight). The plant was selected over others primarily because a noticeable change in height could be tested. The majority of Pinus sp. grows about 15 meters to 45 meters tall. In addition, this species was used over other pine tree species because it had scale leaves in which stoma could be counted. Other hypotheses could have been made and tested to answer the question of how sunlight affects stomata density. Among these are the distance of leaves from the center of the tree, the direction the leaves are facing, and the presence of shade on the leaves. These were ed for by taking the samples of leaves from the inner part and the south side from the same tree with no obstructions creating shade.
MATERIALS AND METHODS On January 8, 2008, samples were collected from the pine tree adjacent to Alumnae Hall and closest to Keezell Hall at James Madison University’s Quad. The samples that constituted as “Low Sunlight” were taken from about 7 feet, and those that labeled as “High Sunlight” were taken from about 15 feet. In addition, the sample was taken from the inner part and south side. Branches from each of these heights were taken back to the lab and 12 scale leaves from each variable were randomly obtained and organized by either “Low Sunlight” or “High Sunlight”. Next, clear nail polish was place on the underside of the scale leaves. After the nail polish dried, clear tape was used to remove the imprint and then placed on a slide. This was repeated with the other 23 scale leaves. Then, the stomata were identified on 400X power on a microscope with the criterion that stomata in the slide had to be either greater than or at least half in the field of view to be counted as one stoma. Two of the four group confirmed the stomata counted which was recorded and repeated with the remaining scale leaves. Later, a micrometer slide was used to determine the area of the field of view for all microscopes used. This was then averaged and then used to find the densities (stoma/mm2) of all 24 data points. A histogram of the frequency of stoma plotted against density was created to observe the spread of the data. A bar graph was created with error bars to analyze the means of the variables. Finally, a two sample t-test was conducted to evaluate the significant difference in the means of the variables at the alpha=0.05 level. RESULTS After the stomata were counted and densities determined, the average, variance, and standard deviation values for both the “Low Sunlight” and “High Sunlight” were determined. Those values of the “Low Sunlight” were 76.91 (stoma/mm2), 145.17, and 12.05 respectively.
Those values of the “High Sunlight” were 60.84 (stoma/mm2), 153.79, and 12.40 respectively. A bar graph with error bars, Figure 1, was created as a graphical representation using those values.
2
(stoma/mm )
Density of Stoma
Mean Values of Stoma Density from Leaves of Different Heights on Pinus sp. 100.00 90.00 80.00 70.00 60.00 50.00 40.00 30.00 20.00 10.00 0.00
Low Sunlight High Sunlight
Low Sunlight
Figure 1. These bar graphs show the mean values of stomatal density with error bars.
High Sunlight
Different Heights (feet)
Figure 2 shows the histogram created to see the spread and normality of raw data points. The data points ranged from 41.32 (stoma/mm2) to 96.42 (stoma/mm2). Also, the median and mode values of the “Low Sunlight” were both 75.76 (stoma/mm2) and those of the “High Sunlight” were 61.98 (stoma/mm2) and 75.76 (stoma/mm2) respectively.
Frequency (number of stoma)
Histogram of Stoma Density from Leaves of Different Heights on Pinus sp. 4.50 4.00 3.50 3.00 2.50 2.00 1.50 1.00 0.50 0.00
Low Sunlight High Sunlight
41-46
47-52
53-58
59-64
65-70
71-76
77-82
83-88
Figure 2. This histogram shows the frequency of stoma as density increases from 41 to 100 (stoma/mm2).
89-94 95-100
2
Density (stoma/mm )
Finally, a two-sample t-test was conducted under the assumption that randomness and normality were not violated, and that the sample was robust. At the alpha level of 0.05 and degrees of freedom of 22, the critical t value was calculated at 1.717144. The t-statistic was calculated as 3.21958546.
DISCUSSION The research hypothesis, different leaf heights in Pinus sp. have an effect on stomatal density, was ed and thus the null hypothesis rejected; the t-statistic was greater than the calculated t-value, 3.22>1.72. This means that there is 95% or greater a chance that this difference in means didn’t randomly happen by chance. However, the prediction that leaves on higher levels have more stoma than those on lower levels was not warranted. In fact, we are 95% certain that the opposite is true. Figure 1 shows the difference in means: the mean value for “Low Sunlight” was 76.91±12.05 (stoma/mm2) and the mean value for “High Sunlight” was 60.84±12.40 (stoma/mm2). Next, the t-test may not have been most ideal for the data that was collected. The histogram in Figure 2 shows that the data of “Low Sunlight” is pretty much normal though skewed a little to the left, but the data of “High Sunlight” is not normal and skewed to the right. As a result, more samples should’ve been taken to increase the robustness of the data. Overall, the experiment s that lower leaves on Pinus sp. have more stomata than higher ones. This could be because of the plant’s adaptation to water stressed environments over centuries. Because noon is where water loss is most likely to occur, perhaps the trees have adapted by opening stomata at the bottom of the tree more often than at the top. The leaves at the top would create shade for those at the bottom, limiting water loss. Since the stomata would be opened at the bottom of the tree more often than at the top, more stomata at the bottom would allow for better water control. In addition, this may explain the fact why the tree is shaped like a cone on its base, though further testing would be required. At noon, the surface area to volume ratio of a cone is very low with respect to sunlight, reducing the chance of plant desiccation. It
seems logical for the plant to have more stoma in bottom of the tree where it can actually open them and without worrying too much about water loss because of the upper leaves’ shade. The samples were taken from only one species; extending the sample to a greater pool would make the data statistically more significant and applicable. In addition, increasing the variety of heights would be very helpful in determining a correlation. Possible future studies could test if a tree’s shape correlates with stomatal density. Specifically, the pine tree used in the experiment could be tested to observe whether stomatal density correlates with its cone shape. Finally the effect of shade on stomatal density would be helpful in determining why there are a greater number of stomata at lower heights of the Pinus sp. than there are at higher heights. LITERATURE CITED Hetherington AM, Woodward FI (2003). The role of stomata in sensing and driving environmental change. Nature 424, 901–908. Tichà I (1982). Photosynthetic characteristics during ontogenesis of leaves. 7. Stomata density and sizes. Photosynthetica 16, 375–471.
Related Documents 171j1w
Stomata Lab 3c4154
October 2019 46
Stomata Lab Key1 54294c
December 2019 34
Stomata 1r6t13
November 2019 79
Fungsi Stomata Pada Daun 104e1e
November 2019 115
Laporan Klorofil Stomata 53014
November 2019 58