Sainsbury Report Final_merged 4p2k54
This document was ed by and they confirmed that they have the permission to share it. If you are author or own the copyright of this book, please report to us by using this report form. Report r6l17
Overview 4q3b3c
& View Sainsbury Report Final_merged as PDF for free.
More details 26j3b
- Words: 11,581
- Pages: 38
J SAINSBURY’S PLC ANALYST EQUITY REPORT Volume 1, Issue 1
EQUITY REPORT RESEARCH EUROPE
STUDENT ID- 1035280, AFSA
16/01/2013
FIVE YEAR SUMMARY We have suggested a BUY recommendation for Sainsbury’s share at £5.32p. Based on the calculation it suggested that Sainsbury’s share price has been UNDERVALUED and we recommended a BUY due to the Sainsbury’s potential domestic growth and expansions within Britain as well as showing encouraging performance during the 2008-2009 economic crisis.
Performance: During the five year including estimate 2012E financial data, Sainsbury’s have managed to keep producing increasing rev-
£3.51p 19 March 2011
SUMMARY Recommendation
BUY
Target price (£)
£5.32
Shares (millions)
1872
ROCE (E2009)
24.71%
Beta
0.62
P/E (E2011) P/B (E2011)
14.76 1.83
enues and comprehensive income expect in 2009 recording a negative Total sales growth comprehensive income. Expansion: Sainsbury’s borrowings have increased in order to finance their growing company by opening more outlet and also diversification into financial services. Corporate Responsibility: Customers and other stakeholders have gained the trust of Sainsbury’s to act responsibly on their behalf. Sainsbury's goal is to offer their customers great quality product at a reasonable price, since the financial crisis customers are more conscientious of how they spend. Like for like Sales: Sainsbury’s performance during this period has been exceptional with their like-for-like sales for the year 2.3%. With this growth it has enabled the company to maintain a good level of shareholders return (Year 2011 - Annual Report).
4.9%
Company Overview Sainsbury is the third largest British retailer in the UK (Telegraph, 2012). Sainsbury became popular by offering quality dairy products at low prices (Datamonitor 360, 2012) with main strong competitors such as ASDA, Tesco, Marks and Spencer group and Morrison's. Sainsbury also engages in financial service, property investments, fuel as well as retailing such as food other household items. Sainsbury’s have proven to be high successful within the UK with market share of 16.3% (Sainsbury, 2012).
Aim of Report The main focus of this report is to analyse and interpret the financial statement of Sainsbury for a four year period (2008-2011) and also forecast their 2012 statements based on analyst reports and assumptions. This is broken down into different parts for detail breakdown of analysis and interpretation;
The first section will analyse Sainsbury’s financial position while also looking at their credit status which will be compared to Tesco plc and industry average. This will be done with the use of ROCE and credit status ratios.
The second section involves the use of common size and trend analyses to forecast Sainsbury 2012 financial statement based on analyst revenue projection report. I will utilise the CAGR formula to estimate my own judgment of the
Share price movement between Sainsbury's (Blue Line) and Tesco (Red Line) from 2008—2011
Throughout the analysis report for the four years’ timeline (2008-2011), Tesco Plc will be used as Sainsbury comparative competitor. The calculated
revenue figure while also comparing it with the
ratios will be used as a comparison medium between
actual 2012 financial statement..
the two companies. In order to draw conclusions
The final section calculates the company’s fore-
based on their financial performance over the four
casted value of equity per share at the end of the 2011 with the use of Residual Earnings Model.
J SAINSBURY’S PLC
year period.
ID: 1035280
Page 2
Reformulation of Financial Statements For an effective equity analysis, both Sainsbury’s and Tesco’s financial statements (i.e. Balance Sheet, Cash flow Statement and Income Statement) are reformulated. Reformulation of financial statements requires the separation of financing and operating items in the financial statement. This differs from traditional credit analysis which classifies them into current and long term (Penman, 2010). All in all, reformulation provides the following benefits (Penman, 2011); reformulating also help in distinguish different components of income such as core operating income from sales, other core operating income, and unusual items, which facilitates forecasting.
Profitability Analysis Maclaney (2002), states that ratio helps to provide an overview of the business financial condition; it is the first step of assessing Sainsbury’s and Tesco in of performance, liquidity and solvency. The calculated profit analysis ratios (ROCE break-down) will help us establish Sainsbury’s and Tesco historic performance over the period (2008 - 2011) -including the economic downturn in 2007-2008. Ratio analysis for Sainsbury's: Ratios (Level 1&2)
Abbreviations
Return on Common Equity (%) Return on Net Operating assets (%) Operating Profit Margin (%) Asset Turnover Financial Leverage (%) Net Borrowing Cost (%)
ROCE RNOA
Operating Leverage (%)
OLLEV
PM
ATO FLEV NBC RNOA - NBC FLEV x (RNOA-NBC)
2008
2009
2010
2011
13.58 10.70 4.23 2.53 42.88 3.98 6.71 287.87 41.89
-9.05 -4.44 -1.54 2.87 50.46 4.71 -9.14 -461.33 49.54
10.33 7.51 2.72 2.76 45.51 1.32 6.19 281.85 47.27
12.41 9.51 3.44 2.76 40.84 2.41 7.10 289.77 45.88
2008
2009
2010
2011
Ratio analysis for TESCO PLC: Ratios (Level 1 & 2)
Abbreviations
Return on Common Equity (%)
ROCE
21.10
14.40
15.32
16.59
Return on Net Operating assets (%)
RNOA
13.00
7.67
10.58
11.62
Operating Profit Margin (%)
PM
5.33
3.60
4.63
4.94
Asset Turnover
ATO
2.44
2.13
2.28
2.35
Financial Leverage (%)
FLEV
63.00
96.42
69.82
55.71
Net Borrowing Cost (%)
NBC
0.15
0.69
3.79
2.72
RNOA - NBC
12.85
6.98
6.79
8.91
FLEV x (RNOA-NBC)
809.68
673.12
474.16
496.14
OLLEV
50.86
63.59
71.05
73.72
Operating Leverage (%) J SAINSBURY’S PLC
ID: 1035280
Page 3
Profitability Analysis (Continued) ROCE (2008-2011) 25.00 20.00 15.00 10.00 Sainsbury's
% 5.00
Tesco
0.00 -5.00
2008
-10.00
2009
2010
2011
Years
-15.00
Looking at the graph above, it shows that Sainsbury’s ROCE dipped very low in 2009 compared to Tesco. This could be due to credit crunch crises which affected the whole economy especially consumer spending's. There are several value drivers’ ratios that could explain why Sainsbury’s ROCE fell lower than Tesco. However, during the recession Sainsbury till managed to hold 16.1% market share compared to the previous year of 15.8% (Farnham , 2009). Although, Sainsbury’s generated a negative operating profit of (£292.07) during this period. Sainsbury ROCE recovered and rose to 12.41% in 2011, which was gradually increased from a negative (9.05%) in 2009. RNOA ratio for Sainsbury’s showed a negative -4.44% in 2009. This could be due to having a negative operating profit because of the economic crises in 2009 which had an adverse effect on the pension scheme. It resulted in reductions in net operating assets in that year. However, Tesco’s RNOA ratio has been more stable over the four year period compared to Sainsbury’s. In the aftermath of the economic crisis, this made little impact on Tesco’s financial position due to its highly diversified business. Although, Tesco suffered losses on their dirty surplus items such as pension scheme and foreign currency translation, overall it led to a decrease in NOA which relatively led to a low RNOA in 2009. Furthermore, after 2009 both retailers saw growth due to improvements in the economy and thus an increase in consumer confidence. J SAINSBURY’S PLC
ID: 1035280
Page 4
Profitability Analysis (Continued) Operating Profit Margin (PM)- in 2008, 2010 and 2011 both companies had a stable and positive PM. But in 2009, Sainsbury’s had a negative PM which was down to the effect of the economic crisis, this gradually improved by 2010. Regardless of the economic crises both companies still managed to generate increased sales revenue throughout the four year timeline which did not have a major influence on a dramatic increase in cost of sales. Several articles revealed that both retailers implemented price war strategic plans between other competing market share retailers in order to attain a favourable profit margin. Asset Turnover (ATO) Over the four year period,
ATO (2008-2011)
ATO for both firms has been fairly constant consid-
4.00
ering consumer attitudes towards spending in reces-
3.00
sion. Although in 2009 when the economy per-
%2.00 1.00
Sainsbury's
formed poorly, it had a positive effect on Sains-
Tesco
bury’s ATO. Compared to Sainsbury’s in this year,
0.00 2008 2009 2010 2011
Tesco generated a lot more sales revenue than Sainsbury’s during this period. However, Tesco was less
efficient in using its assets to generate revenue in this year in comparison to Sainsbury’s and other years. Sainsbury’s cash flow statement (Cash Investment (I)) shows that the firm invested in t venture and associates - IT services firm (Taylor, 2012) in order to be provide better online services. However, compare to Tesco who invested heavily on PPE which can be concluded to be their highest investment throughout the four years. In order to improve efficiency and ATO overall, Tesco should be cautious in what it invests in during uncertain economic periods. For example, Sainsbury’s did not invest heavily on operating assets but rather utilised existing assets. ATO can also be broken down into different levels such as Inventory and PPE turnover. For the breakdown calculation ATO refer to Appendix 4.1a. On average both Sainsbury’s and Tesco have 2.73 and 2.30 ATO respectively.
Net Borrowing Cost (NBC) - on average both Sainsbury’s and Tesco have 3.11% and 1.83% NBC ratio respectively. Sainsbury’s had the highest NBC between 2008-2009, which worsen in 2010 and gradually improved by 2011. While, Tesco’s NBC was at its lowest in 2008, which gradually improved by 2010. This meant that Tesco cost of borrowings dropped, when interest rate decreased to 2.0% in 2008 (HouseWeb, 2012). This suggested that on average Tesco were better strategically by taking advantage of the fall in interest rate by borrowing more compared to Sainsbury’s who did not make use of the fall in interest rate. The graph below shows the difference in both companies total borrowing (short term and long term) during the four year period. J SAINSBURY’S PLC
ID: 1035280
Page 5
Profitability Analysis (Continued)
Total Borrowings (2008-2011) Axis Title
20000 15000 10000
Sainsbury's
5000
Tesco
0 2008
2009
2010
2011
Years Operating Spread (SPREAD) (RNOA>NBC) - Both Sainsbury’s and Tesco had a desirable Operating Spread over the four year on average (except year 2009), especially in 2011 for Sainsbury’s and 2008 for Tesco. In situations when a positive spread is achieved it means the chances of shareholders receiving greater return are high. This suggests that Tesco and Sainsbury’s have earned more returns on their Net Operating assets to be able to cover the borrowing costs. Sainsbury’s obtained a negative NBC in 2009 as RNOA was less than NBC. Year 2009 was a generally poor economy for both retailers and the general public, it affected Sainsbury’s in which a negative Spread of -9.14% was attained. The manager at Sainsbury did not do a good job i.e. a higher costs of borrowing was incurred due to poor decision making during the financial crises in 2009. The managers went over ‘optimum’ borrowing levels, which meant that all financial liabilities could not be covered by operating income and also it led to attaining a high gearing ratio (FLEV). This could have been avoided if careful attention was paid to financial liabilities and the borrowings of finance was wrongly timed. Operating Liability Leverage - Sainsbury’s have managed to maintain their ratio below 50% while
Tesco’s ratio shows continuous increase throughout the four year period. Tesco’s continuous increase could be due to generated higher operating liabilities and revenues mainly because they have many outlets compared to Sainsbury’s. Sainsbury’s ratio was at its maximum in 2009 and after that it declined.
J SAINSBURY’S PLC
ID: 1035280
Page 6
Profitability Analysis (Continued) Financial Leverage (FLEV) -
Sainsbury’s is not as geared as Tesco’s which ratio stood at 96.4% in
2009, while Sainsbury’s was at 50% for the same year. Tesco’s high gearing ratio was because of the increase in lending in the wake of low interest rate. Overall, it can be said that Sainsbury’s were less risky in comparison to Tesco. One of the main reasons why Tesco was highly geared in 2009 could be due to the fall in interest rate in the UK. Unfortunately, Sainsbury’s did not take advance of the fallen interest rate but rather they played safe in order to avoid huge finance cost due to the uneven market. After 2009, borrowing for both retailers gradually decrease by a low percentage and this was expected to reduced FLEV - this was reflected
in
years
2010
&
2011.
Analysis of Credit Status and other performance ratios For most creditors, they are concerned about a firm’s ability to meet its short-term and long-term obligations through analysing their liquidity, solvency and operating ratios based on the reformulated financial statements i.e. income statement. The commonly recognised ratios will be used to analyse the credit and liquidity status of Sainsbury’s and its competitor Tesco’s. Stock turnover days for both Sainsbury and Tesco have averaged 17 days. Both Sainsbury’s and Tesco have managed to maintain a 14days and 20days stock turnover days respectively which are slightly high but as long as the perishable goods are often rotated. However, both companies also stock domestic items which are less likely to be influenced by technological changes within their holding period. Overall, both retailers have managed to keep an eye on the amount of stock by knowing their Economic Order Quantity (EOQ) which reflected on their steady stock turnover ratios over the four years. Sainsbury’s better performance on this ratio than its competitor is because they hold less stock than Tesco, which means Tesco takes longer to replenish its stocks Debtors Days - Sainsbury’s have a relatively average of four debtor days for the first three years, which
gradually increased to 5days after the financial crises. Due to Sainsbury’s policy, majority of their customer transactions are done on a cash basis which means less credit sales are offered to customers. Compared to Tesco which has increasing debtors days, this could signify that credit sales are offered to customers in order to generate more revenue. Due to high diversification by Tesco in the market, there is incentive to increase their debtors to increase customers. J SAINSBURY’S PLC
ID: 1035280
Page 7
Analysis of Credit Status/ other performance ratios (Continued) Sainsbury’s other ratios Other Performance Ratios Debtors Days Creditors Days Current Ratio(:1) Quick Ratio(:1) Stock Turnover Days Interest Cover (times) Gross Profit Margin(%) Cash Flow to Sales(%) Cash Flow to Assets(%)
2008
2009
2010
2011
4.22 49.43 0.66 0.40 14.76 4.02 5.62 5.08 8.96
3.76 50.80 0.55 0.31 14.07 4.55 5.48 5.38 10.13
3.93 47.67 0.66 0.41 13.57 4.80 5.42 5.47 10.07
5.93 47.53 0.58 0.31 14.86 7.34 5.50 4.51 8.35
Tesco’s other ratios Other Performance Ratios Debtors Days Creditors Days Current Ratio(: 1) Quick Ratio(t:1) Stock Turnover Days Interest Cover (times) Gross Profit Margin(%) Cash Flow to Sales(%) Cash Flow to Assets(%)
2008
2009
2010
2011
10.12 60.82 0.61 0.38 20.31 11.46 7.67 7.83 12.27
12.08 62.08 0.78 0.63 19.44 6.94 7.76 8.43 9.94
12.11 65.89 0.73 0.56 19.04 6.03 8.10 9.40 11.62
13.86 68.49 0.67 0.49 20.66 8.01 8.30 7.36 9.50
Creditors Days - Creditor’s days for Sainsbury’s and Tesco reveals that they both obtain payments from their debtors first before paying their creditors. This should reflect a better working capital for both retailers. In 2009, it took Sainsbury’s few days longer than average to pay their creditors due to the economic situation. However, Tesco’s creditor’s days continued to rise which meant they took longer to pay their creditors than Sainsbury’s after 2009. This could have been the result of a stronger relationship between Tesco and its suppliers resulting in stronger cash flow statement. Sainsbury’s suppliers on the other hand, seems to requests their payment earlier after 2009 - which is reflected on their ratio i.e. decreasing (20092011). Current Ratio - The higher the current ratio, the more capable the company is of paying its obligations (Investopedia 2012). Sainsbury’s and Tesco were able to cover their short-term financial obligations but the ratio was not strong enough. On average, Sainsbury’s has (0.61:1) while Tesco had (0.70:1). However, in 2011 Sainsbury’s ratio dropped slightly which was below the industry average when industry average was at 0.60:1(Thomson One Banker, 2013). Over the four year period, Sainsbury’s current ratio seems rather unpredictable, while Tesco’s current ratio increased from 2008-2010 and later decreased slightly by 2011. The fall in interest rate cause Tesco’s increased current ratio which led to Tesco borrowing more and having more cash in hand in order to survive during the financial crises. While Sainsbury’s utilised their liquidity assets for promotion and marketing which seemed profitable and generated increased sales revenue, but worsened current ratios. J SAINSBURY’S PLC
ID: 1035280
Page 8
Analysis of Credit Status/ other performance ratios (Continued) Quick Ratio- is an indicator of short term liquidity and also the ability for the companies to meet its short
term obligation without the use of its liquid assets. The ratio calculated for Sainsbury’s and Tesco show the ability to both of them surviving without relying on stock (inventory). Sainsbury’s ratio is rather unstable and unpredictable either it will increase or decrease. Unlike Tesco, thia ratio increased from 2008-2010 and later decreased in 2011. The calculated ratio signifies that on average Tesco relies more on their stock compared to Sainsbury’s. The decline in Sainsbury’s quick ratio may have resulted from Sainsbury’s missed opportunities to borrow funds when interest rates were low, as cash held declined slowly over the four year periods. Moreover in 2011, Sainsbury’s held the least cash in comparison to other years and also industry average ratio is the ratio the same as Sainsbury’s ration 0.31:1 (Thomson One Banker, 2013)
Sainsbury's Quick & Current Ratio
Tesco's Quick & Current Ratio
0.50
Ratio(:1)
Ratio(:1)
1.00 Quick Ratio
0.00 2008
2009
2010
2011
Current Ratio
1.00 0.50
Quick Ratio
0.00 2008 2009
2010 2011
Current Ratio
Years
Years Gross Profit - Sainsbury’s gross profit ratio
Gross Profit Margin
appears to be decreasing from 2008-2010. But regardless of the decrease in the ratio,
10.00
creasing healthy revenue each year. However,
%
Sainsbury’s still managed to maintain in5.00
Sainsbury's
cost of sales also increased which contributed to the slight decrease in the ratio. On the other hand however, Tesco’s ratio showed a con-
Tesco
0.00 2008
2009
2010
2011
Years
tinuous increase in its gross profit ratio which
was mainly due to the increase in sales turnover. The fall in Sainsbury’s ratio could be due to lack of bargaining power in of negotiations with their creditors in order to receive better discounts for goods. Sainsbury’s ratio in 2011 seems to be above the industry average which was at 6.85. This means on average they are performing okay. J SAINSBURY’S PLC
ID: 1035280
Page 9
Analysis of Credit Status/ other performance ratios (Continued) Cash flow to Assets – this ratio helps to measures how well a company is able to generate operating cash from its current operating activities. Both Tesco’s and Sainsbury’s ratios has been unstable over the timeline. The ratio is affected when either of the retailers invests or sells fixed assets or an increase/decrease in cash from operations. Sainsbury’s was very efficient in 2009 as Tesco was also in 2008. Nevertheless, in 2011 both retailers’ total assets were at the highest which made the ratio to fall to its lowest. As a result, both retailers were not efficient in maximising the full capacity of their assets as less cash was generated from operations. Cash flow to Sales –the higher the ratio the better, because it indicates the level the company’s financial strength. The ratio also indicates the ability for both Sainsbury’s and Tesco to translate their sales into cash (proportion of cash from operations in overall sales). Both companies experienced an improvement in the ratio up until 2010. The decrease in 2011 was due to both companies experiencing a decrease in cash from operations as sales continued to rise. I personally think that the increased rate at which Tesco offered credit sales to their customers might have had an adverse impact on the ratio.
Interest Cover - A high interest cover ratio means that a business can easily meet its interest obligations from profits (Bized, 2012). The ratio tells how easily Sainsbury’s and Tesco’s can pay interest on their outstanding debts. Sainsbury’s had much lower interest cover in comparison to Tesco’s over the four year timeline. Which means Tesco can cover their interest debt many times than Sainsbury’s. For example, Tesco were able to cover their interest twelve times in 2008 while Sainsbury could only cover theirs four times. Again, based on the financial crisis in 2009 Tesco’s ratio decreased, this could also be due to increase in borrowings while Sainsbury’s ratio still gradually increased from 2008 - 2011. A lower interest cover could mean danger to a business, but luckily
Interest Cover
Sainsbury ratio peaked in 2011 mainly because Sains14.00
bury’s finance cost was at its lowest during this period.
12.00
Overall, Sainsbury’s ratio was much lower than total borrowings (short and long term borrowings) in
Times
Tesco’s, this could be due to Sainsbury’s have a lower
10.00 8.00
Sainsbury
6.00
Tesco
4.00
comparison to Tesco’s . It is still uncertain why Sains-
2.00
bury’s borrowed lesser amount when they could have
0.00 2008
2009
2010
2011
taken the advantage of a reduce interest rate at 0.5%.
J SAINSBURY’S PLC
ID: 1035280
Page 10
Forecasting and Share Price Valuation This part aims to explain how Sainsbury’s forecasted equity share price was arrived at the end of the fourth year (2011). Based on my evaluation, the calculated value of Sainsbury’s share might help investors into making the right decision on either to buy, sell or hold Sainsbury’s shares. By using Residual Earnings Model which is the most commonly used model by analyst (Investopedia, 2012) , the share price calculated by using this model will be compared to the actual share price of Sainsbury’s as at 19th March 2011.
In order to calculate my own estimation of 2012’s revenue, I made use of the “Compound Annual Growth Rate (CAGR)” - RBS (analysts) use the same method for forecasting (Scarborough, 2012). I chose to use this model for forecasting 2012 revenue and used the common size and trend analysis to forecast
the
rest
of
the
income
statement.
The formula s for growth rate changes from year to year (4.29%) which was later multiplied with 2011 revenue in order to arrive at my own predictions of 2012 revenue figure - which was close to the actual and other analyst revenue figures. The analyst revenue figures includes macro-economic factors such as cost of inflation, but these predictions varies from analyst to analyst so it can tend to be subjective.
CAGR Model Rate
4.29%
Year 2011 Revenue
£21102
CAGR Model Revenue
£22007
Analyst Revenues
£
RBS
22540
Evolution Securities Plc
22085
Santander
22325.6
My predicted Revenue was quite close to the actual 2012 Revenue (£22,294 m). The next stage was to gather twenty four years’ worth of Sainsbury’s share prices and FTSE ALL SHARE price index (Appendix 1.3a). I was able to calculate the return index for both Sainsbury’s and FTSE ALL SHARE. This enabled to arrive at a beta by using the regression analysis tool.
J SAINSBURY’S PLC
ID: 1035280
Page 11
Forecasting and Share Price Valuation Continuation ANOVA df Regression Residual Total
Intercept X Variable 1
SignifiSS MS F cance F 1 0.260358339 0.260358 52.47244 4.03E-12 287 1.424039673 0.004962 288 1.684398012
Coeffi- Standard ErLower Upper cients ror t Stat P-value 95% 95% 0.001231 0.004166711 0.295457 0.767858 -0.00697 0.009432 0.618599 0.085397227 7.243787 4.03E-12 0.450515 0.786684
Lower 95.0% -0.00697 0.450515
Upper 95.0% 0.009432 0.786684
By using a regression analysis tool I was able to arrive at Sainsbury’s Beta which was later used in conjunction with CAPM to calculate Sainsbury’s ‘Cost of Equity’. CAPM can be described as “a model that describes the relationship between risk and expected return and that is used in pricing risky securities” (Investopedia, 2013)
(Investopedia, 2013)
Through this method (CAPM) I was able to arrive at Sainsbury’s cost of equity at 7.58%. The true worth of a company’s share price is very important to shareholder and other stakeholders (such as investors) in order to aid them in buying or selling shares. The calculated forecasted value of equity per share was estimated based on Evolution Security Plc (analyst) forecasted revenue estimate and the actual 2011 data. The ‘Residual Earning Model’ has been used to value Sainsbury’s share price as at the end of March 2011. Three different assumptions have been put into perspective when using this formula to calculate the earnings per share. While calculating the third case perspective (Case 3), 0.7% economic GDP was used since retailer industry has been growing in line with the economy which was at 0.7% in 2011 (BBC, 2012).
J SAINSBURY’S PLC
ID: 1035280
Page 12
Forecasting and Share Price Valuation Continuation Valuation : Residual Earnings (RE) Model 2011 (£m)
E2012 (£m)
Reformulated Income statement Operating income
726.48
773.11
-53.48
-51.87
673.00
721.24
Net financial expenses Comprehensive income (included the amount for MI)
Reform. Balance Sheet Net operating assets
7639.00
Net financial obligations Ordinary shareholders' equity (included MI)
2215 5424.00
310.1
Residual Earnings
Case 1: Assume that RE after 2012 would be zero because of strong competition in the industry. 5712.25 Intrinsic value of BT's equity in 2011 3.05 Intrinsic per share value (£’s) 1.05 Intrinsic P/B 8.49 Intrinsic P/E Case 2: if it assumes that REs after 2012 will remain as 310.1 forever. Intrinsic value of BT's equity in 2011 Intrinsic per share value (£’s) Intrinsic P/B Intrinsic P/E
Case 3:Assuming the growth rate is 0.7% based on the economy GDP Intrinsic value of BT's equity in 2011 Intrinsic per share value (£’s) Intrinsic P/B Intrinsic P/E
9515.04 5.08
1.75 14.14
9931.28
9931.28
5.31
1.83 14.76
Additional information: Share price of Sainsbury on 19 March 2011 is £3.51, source: Sainsbury's Annual Report Therefore, the market over values Sainsbury's share From my calculation Cost of Equity is 7.58% No. of shares outstanding is 1872 million, from Sainsbury 2010/2011 annual report.
J SAINSBURY’S PLC
ID: 1035280
Page 13
Analyst Share Price Assumption Evolution Securities– this analyst initiated a Reduce because Sainsbury’s did not deliver the total sales growth target of 8% but rather they achieved 7.5%. And also the analyst believe that with Sainsbury’s underling growth which were currently unimpressive, in addition with market deterioration and growth rate getting weaker due to inflation. Evolution urges investors to sell Sainsbury’s shares at a target price of 350p. Santander– However, this analyst suggested a Hold of Sainsbury’s share at target price of 400p due to Sainsbury’s attaining three times growth on non-food items which driven by Sainsbury’s opening new outlets in order to boost sales. This means that management strategies have proven to be successful and can be seen in the foreseeable future. RBS– finally, RBS suggested a Hold at the target price of 370p. This is due to Sainsbury’s performing very well in the third quarter or 2011. Although sales growth target are not been achieve, RBS are positive Sainsbury’s can have continuous development in their business model.
SUMMARY The Residual Earnings Model suggests that Sainsbury’s share price should be currently at a value of £5.31. In comparison to the actual share price of £3.51 as at 19th March 2011. The estimated share price is different from the actual which means that the market has undervalued Sainsbury’s shares. Residual earnings model assumes three different cases in calculating the share price of Sainsbury’s. RBS suggested that investors should Hold on the bases that the share price is likely to increase between the financial year of 2010-2013 and with EPS CAGR of 10%. In conclusion, the market has undervalued Sainsbury’s share and I believe that it has the potential to rise to the target price of £5.31. I would advice investors to buy and hold.
J SAINSBURY’S PLC
ID: 1035280
Page 14
APPENDICES 1.1 – SWOT ANALYIS OF J SAINSBURY’S Strengths
Weaknesses
Significant market presence in the UK
Robust portfolio of own-labelled products
Concentration of operations in the UK could affect the performance in case of any unfavourable economic scenario
Strong results in tough economic and macro environment
High debt burden
Opportunities
Threats
Growth opportunities in the Chinese and Indian economies
Rising labour cost in the UK
Weak consumer spending in the UK
Growth potential in the online distribution channel
Intense competition
Rise in demand for organic foods
Datamonitor 360 (2012)
APPENDICES 1.2– INDUSTRY AVERAGE AS AT 19TH MARCH 2011 Industry Benchmark Ratio analysis : Credit Status Ratios
2011
Stock Turnover Days
23.00
Current Ratio (to 1)
0.60
Quick Ratio (to 1)
0.31
Debtors Days
11.48
Gross Profit Margin(%)
6.85
Cash Flow to Sales(%)
5.66 Thomson One Banker, (2013)
J SAINSBURY’S PLC
ID: 1035280
Page 15
APPENDIX 1.3a DATASTREAM DATA OF SAINSBURY AND FTSE ALL SHARE RETURNS Start
19/02/1987
End Frequency
Name
19/03/2011 M
SAINSBURY (J) PRICE - LNGBP
FTSE ALL SHARE PRICE INDEX
Code
926002(P.LNGBP)
FTALLSH
CURRENCY
£
£
19/02/1987
235.31
960.83
19/03/1987
244.14
994.65
19/04/1987
234.33
979.12
19/05/1987
260.81
1103.1
19/06/1987
284.34
1137.25
19/07/1987
279.43
1234.49
19/08/1987
257.86
1120.81
19/09/1987
274.26
1188.42
19/10/1987
232.37
1074.58
19/11/1987
224.53
824.11
19/12/1987
218.65
867.07
19/01/1988
223.55
902.5
19/02/1988
212.76
889.24
19/03/1988
232.37
951.46
19/04/1988
241.2
925.79
19/05/1988
218.65
909.69
19/06/1988
220.61
956.27
19/07/1988
218.65
961.03
19/08/1988
213.74
961.62
19/09/1988
197.57
912.59
19/10/1988
202.96
968.26
19/11/1988
199.04
951.59
19/12/1988
189.23
913.05
19/01/1989
207.86
985.45
19/02/1989
228.94
1058.89
19/03/1989
217.66
1076.71
19/04/1989
225.51
1076.35
19/05/1989
237.27
1131.41
19/06/1989
260.81
1103.16
19/07/1989
259.82
1170.28
19/08/1989
281.4
1204.75
19/09/1989
279.43
1198.2
19/10/1989
247.08
1100.15
19/11/1989
250.02
1115.15
19/12/1989
253.94
1168.64
19/01/1990
256.88
1169.46
19/02/1990
257.86
1147.05
Return
0.037525 -0.04018 0.113003 0.090219 -0.01727 -0.07719 0.0636 -0.15274 -0.03374 -0.02619 0.02241 -0.04827 0.09217 0.038 -0.09349 0.008964 -0.00888 -0.02246 -0.07565 0.027281 -0.01931 -0.04929 0.098452 0.101414 -0.04927 0.036065 0.052148 0.099212 -0.0038 0.083058 -0.007 -0.11577 0.011899 0.015679 0.011578 0.003815
Return (FTALLSH)
0.035198734 -0.015613532 0.126623907 0.030958209 0.085504506 -0.092086611 0.060322445 -0.09579105 -0.233086415 0.052128963 0.040861753 -0.014692521 0.069969862 -0.026979589 -0.017390553 0.051204256 0.004977674 0.000613925 -0.050986876 0.061002203 -0.01721645 -0.040500636 0.079294672 0.074524329 0.016828944 -0.000334352 0.051154364 -0.024968844 0.060843395 0.02945449 -0.005436813 -0.08183108 0.013634504 0.047966641 0.00070167 -0.01916269
19/03/1990
256.88
1111.57
19/04/1990
247.08
1085.2
19/05/1990
266.69
1117.16
19/06/1990
273.55
1168.35
19/07/1990
296.1
1171.71
19/08/1990
285.32
1065.7
19/09/1990
298.06
1000.73
19/10/1990
301.99
1010.12
19/11/1990
290.22
1009.06
19/12/1990
302.97
1046.13
19/01/1991
307.87
1006.8
19/02/1991
322.58
1115.14
19/03/1991
340.22
1197.98
19/04/1991
362.77
1220.16
19/05/1991
370.62
1188.02
19/06/1991
339.24
1194.88
19/07/1991
368.88
1213.66
19/08/1991
349.05
1216.23
19/09/1991
351.03
1253.48
19/10/1991
354.01
1252.83
19/11/1991
327.23
1190.42
19/12/1991
346.07
1146.78
19/01/1992
362.93
1213.08
19/02/1992
365.91
1216.45
19/03/1992
375.82
1186.78
19/04/1992
420.44
1268.47
19/05/1992
463.58
1312.07
19/06/1992
464.07
1248.12
19/07/1992
445.23
1168.05
19/08/1992
434.33
1122.95
19/09/1992
426.89
1204.37
19/10/1992
472.01
1206.68
19/11/1992
486.88
1284.33
19/12/1992
547.87
1333.41
19/01/1993
554.31
1330.19
19/02/1993
516.13
1387.47
19/03/1993
520.6
1421.34
19/04/1993
462.09
1387.43
19/05/1993
455.15
1393.51
19/06/1993
479.94
1422.43
19/07/1993
454.16
1408.73
19/08/1993
511.67
1521.01
19/09/1993
446.23
1494.29
19/10/1993
405.57
1545.92
19/11/1993
387.72
1533.12
19/12/1993
446.23
1640.19
19/01/1994
473
1743.78
19/02/1994
362.93
1703.02
19/03/1994
384.75
1624.88
-0.0038 -0.03815 0.079367 0.025723 0.082435 -0.03641 0.044652 0.013185 -0.03897 0.043932 0.016173 0.04778 0.054684 0.066281 0.021639 -0.08467 0.087372 -0.05376 0.005673 0.008489 -0.07565 0.057574 0.048718 0.008211 0.027083 0.118727 0.102607 0.001057 -0.0406 -0.02448 -0.01713 0.105695 0.031504 0.125267 0.011755 -0.06888 0.008661 -0.11239 -0.01502 0.054466 -0.05372 0.126629 -0.12789 -0.09112 -0.04401 0.150908 0.059991 -0.23271 0.060122
-0.03093152 -0.023723202 0.029450792 0.045821547 0.002875851 -0.090474605 -0.060964624 0.00938315 -0.00104938 0.036737161 -0.03759571 0.107608264 0.074286637 0.018514499 -0.026340808 0.005774314 0.015717059 0.002117562 0.030627431 -0.000518556 -0.049815218 -0.03665933 0.057814053 0.002778053 -0.024390645 0.068833314 0.034372118 -0.048739778 -0.064152485 -0.038611361 0.072505454 0.001918015 0.064350118 0.038214478 -0.002414861 0.043061518 0.024411339 -0.023857768 0.004382203 0.020753349 -0.009631405 0.079702995 -0.017567274 0.034551526 -0.008279859 0.069837977 0.063157317 -0.023374508 -0.045883196
19/04/1994
355.99
1582.94
19/05/1994
390.7
1571.99
19/06/1994
413.01
1515.01
19/07/1994
396.65
1540.95
19/08/1994
436.31
1598.16
19/09/1994
432.34
1543.64
19/10/1994
395.65
1524.39
19/11/1994
417.47
1554.22
19/12/1994
395.16
1505.86
19/01/1995
416.48
1503
19/02/1995
413.5
1505.8
19/03/1995
423.91
1513.96
19/04/1995
413.5
1556.15
19/05/1995
435.81
1605.78
19/06/1995
441.27
1654.2
19/07/1995
459.12
1674.67
19/08/1995
465.56
1728.26
19/09/1995
455.15
1745.57
19/10/1995
419.45
1757.31
19/11/1995
378.8
1769.5
19/12/1995
363.92
1754.28
19/01/1996
413.5
1831.99
19/02/1996
382.76
1843.95
19/03/1996
372.85
1835.38
19/04/1996
358.47
1924.17
19/05/1996
382.76
1901.77
19/06/1996
388.71
1883.36
19/07/1996
370.86
1841.45
19/08/1996
402.59
1908.96
19/09/1996
371.85
1957.02
19/10/1996
353.01
1987.45
19/11/1996
362.43
1954.08
19/12/1996
375.82
1979.85
19/01/1997
393.17
2061.07
19/02/1997
313.35
2121.75
19/03/1997
325.74
2115.4
19/04/1997
324.26
2092.44
19/05/1997
363.92
2211.91
19/06/1997
358.96
2210.2
19/07/1997
424.91
2284.14
19/08/1997
437.3
2317.83
19/09/1997
443.75
2362.31
19/10/1997
461.6
2480.18
19/11/1997
472.5
2285.91
19/12/1997
484.9
2361.28
19/01/1998
499.28
2467.54
19/02/1998
449.7
2647.24
19/03/1998
502.75
2797.33
19/04/1998
477.96
2777.16
-0.07475 0.097503 0.057103 -0.03961 0.099987 -0.0091 -0.08486 0.05515 -0.05344 0.053953 -0.00716 0.025175 -0.02456 0.053954 0.012528 0.040451 0.014027 -0.02236 -0.07844 -0.09691 -0.03928 0.136239 -0.07434 -0.02589 -0.03857 0.06776 0.015545 -0.04592 0.085558 -0.07636 -0.05067 0.026685 0.036945 0.046166 -0.20302 0.03954 -0.00454 0.122309 -0.01363 0.183725 0.029159 0.01475 0.040225 0.023614 0.026243 0.029656 -0.0993 0.117968 -0.04931
-0.025811137 -0.006917508 -0.03624705 0.017121999 0.037126448 -0.034114231 -0.012470524 0.019568483 -0.031115286 -0.001899247 0.001862941 0.005419046 0.027867315 0.031892812 0.03015357 0.012374562 0.032000334 0.010015854 0.006725597 0.006936739 -0.0086013 0.044297376 0.00652842 -0.004647631 0.048376903 -0.011641383 -0.009680456 -0.022252782 0.036661327 0.025176012 0.015549151 -0.01679036 0.013187792 0.04102331 0.029441019 -0.002992813 -0.010853739 0.057096022 -0.000773088 0.033453986 0.014749534 0.019190363 0.049896076 -0.078328992 0.032971552 0.045001016 0.072825567 0.056696786 -0.007210447
19/05/1998
511.18
2794.62
19/06/1998
515.64
2726.87
19/07/1998
525.06
2882.73
19/08/1998
529.52
2646.95
19/09/1998
540.43
2354.83
19/10/1998
569.19
2348.1
19/11/1998
510.68
2567.36
19/12/1998
460.6
2607.39
19/01/1999
431.85
2730.74
19/02/1999
363.18
2764.7
19/03/1999
359.46
2847.18
19/04/1999
411.52
3010.25
19/05/1999
407.06
2911.37
19/06/1999
381.77
3028.03
19/07/1999
386.98
3030.3
19/08/1999
406.81
2886.03
19/09/1999
409.29
2846.58
19/10/1999
373.34
2799.26
19/11/1999
315.58
3033.78
19/12/1999
326.24
3150.24
19/01/2000
349.05
3069.72
19/02/2000
288.31
2948.99
19/03/2000
251.37
3126.18
19/04/2000
304.67
2937.83
19/05/2000
337.89
2892.43
19/06/2000
298.72
3095.44
19/07/2000
306.41
3102.86
19/08/2000
322.27
3143.84
19/09/2000
361.44
3084.07
19/10/2000
366.9
2977.26
19/11/2000
424.41
3085.5
19/12/2000
409.54
3009.03
19/01/2001
338.14
2992.06
19/02/2001
381.77
2944.93
19/03/2001
369.87
2688.78
19/04/2001
390.7
2818.19
19/05/2001
421.44
2860.21
19/06/2001
422.43
2753.8
19/07/2001
425.4
2628.57
19/08/2001
385.49
2590.61
19/09/2001
366.9
2272.17
19/10/2001
349.79
2406.13
19/11/2001
373.84
2578.75
19/12/2001
347.31
2478.95
19/01/2002
372.85
2487.99
19/02/2002
404.58
2461.12
19/03/2002
392.18
2571.43
19/04/2002
394.66
2548.05
19/05/2002
386.23
2537.41
0.069504 0.008725 0.018269 0.008494 0.020604 0.053217 -0.1028 -0.09807 -0.06242 -0.15901 -0.01024 0.144828 -0.01084 -0.06213 0.013647 0.051243 0.006096 -0.08784 -0.15471 0.033779 0.069918 -0.17402 -0.12813 0.212038 0.109036 -0.11593 0.025743 0.051761 0.121544 0.015106 0.156746 -0.03504 -0.17434 0.129029 -0.03117 0.056317 0.078679 0.002349 0.007031 -0.09382 -0.04822 -0.04663 0.068756 -0.07097 0.073537 0.085101 -0.03065 0.006324 -0.02136
0.006286998 -0.02424301 0.057157107 -0.081790525 -0.110360982 -0.002857956 0.093377624 0.015591892 0.047307844 0.012436189 0.029833255 0.057274215 -0.03284777 0.040070482 0.000749662 -0.047609148 -0.013669297 -0.016623457 0.083779285 0.038387754 -0.025559957 -0.03932932 0.060084978 -0.06024925 -0.015453583 0.07018666 0.002397074 0.01320717 -0.019011782 -0.034632807 0.036355575 -0.024783666 -0.005639691 -0.015751689 -0.086979996 0.048129635 0.014910279 -0.037203562 -0.045475343 -0.014441312 -0.122920856 0.058956856 0.07174176 -0.038700921 0.003646705 -0.010799883 0.044821057 -0.009092217 -0.004175742
19/06/2002
347.06
2270.73
19/07/2002
317.32
1995.47
19/08/2002
325.25
2128.84
19/09/2002
308.89
1852.07
19/10/2002
268.98
1973.16
19/11/2002
290.54
1966.6
19/12/2002
267.74
1850.02
19/01/2003
244.93
1844.77
19/02/2003
225.84
1762.53
19/03/2003
235.01
1803.22
19/04/2003
232.53
1867.76
19/05/2003
257.32
1915.87
19/06/2003
256.83
2018.05
19/07/2003
260.79
2002.16
19/08/2003
288.31
2099.84
19/09/2003
290.79
2111.57
19/10/2003
271.7
2155.15
19/11/2003
295.75
2138.58
19/12/2003
300.21
2175.41
19/01/2004
289.55
2244.62
19/02/2004
296
2253.94
19/03/2004
294.76
2209.84
19/04/2004
277.65
2264.9
19/05/2004
272.45
2217.22
19/06/2004
277.4
2238.01
19/07/2004
257.5
2157.19
19/08/2004
257.5
2166.93
19/09/2004
278
2281.88
19/10/2004
249
2308.58
19/11/2004
270.5
2370.35
19/12/2004
266
2352.37
19/01/2005
272.5
2422.06
19/02/2005
300.5
2534.73
19/03/2005
293.5
2476.21
19/04/2005
291.25
2434.24
19/05/2005
290.75
2472.76
19/06/2005
284.25
2544.59
19/07/2005
280
2600.39
19/08/2005
283.25
2661.32
19/09/2005
283.5
2724.41
19/10/2005
277.5
2587.2
19/11/2005
288.5
2765.34
19/12/2005
309
2803.53
19/01/2006
305.25
2888.41
19/02/2006
318.75
2979.74
19/03/2006
330
3062.18
19/04/2006
341
3102.69
19/05/2006
331
2884.1
19/06/2006
324.75
2865.1
-0.10142 -0.08569 0.024991 -0.0503 -0.1292 0.080155 -0.07847 -0.08519 -0.07794 0.040604 -0.01055 0.10661 -0.0019 0.015419 0.105526 0.008602 -0.06565 0.088517 0.01508 -0.03551 0.022276 -0.00419 -0.05805 -0.01873 0.018168 -0.07174 0 0.079612 -0.10432 0.086345 -0.01664 0.024436 0.102752 -0.02329 -0.00767 -0.00172 -0.02236 -0.01495 0.011607 0.000883 -0.02116 0.03964 0.071057 -0.01214 0.044226 0.035294 0.033333 -0.02933 -0.01888
-0.105099294 -0.121220929 0.066836384 -0.130009771 0.065380898 -0.003324616 -0.059279976 -0.002837807 -0.044580083 0.023086132 0.035791528 0.025758127 0.053333473 -0.007873938 0.04878731 0.00558614 0.020638672 -0.00768856 0.017221708 0.031814692 0.00415215 -0.019565738 0.024915831 -0.021051702 0.009376607 -0.036112439 0.004515133 0.053047399 0.011700878 0.026756708 -0.007585378 0.029625442 0.046518253 -0.023087272 -0.016949289 0.015824241 0.029048513 0.021928877 0.023431101 0.023706281 -0.050363198 0.06885436 0.013810237 0.030276116 0.031619472 0.027666843 0.013229137 -0.070451769 -0.006587844
19/07/2006
334
2932.45
19/08/2006
359.5
3001.06
19/09/2006
372.75
2982.91
19/10/2006
395.25
3149.97
19/11/2006
410.5
3184.87
19/12/2006
408.25
3206.5
19/01/2007
434.25
3229.02
19/02/2007
512.75
3340.86
19/03/2007
557
3220.5
19/04/2007
530
3345.25
19/05/2007
556
3449.69
19/06/2007
581
3436.71
19/07/2007
592
3433.75
19/08/2007
520.5
3128.97
19/09/2007
554
3319.35
19/10/2007
582
3355.25
19/11/2007
408
3135.95
19/12/2007
425.5
3192.35
19/01/2008
399.5
3003.52
19/02/2008
381.5
3053.21
19/03/2008
325
2840.75
19/04/2008
379.5
3090.06
19/05/2008
366.25
3243.48
19/06/2008
322.5
2905.97
19/07/2008
298.5
2735.72
19/08/2008
326.75
2710.74
19/09/2008
370.25
2708.98
19/10/2008
250.5
2050.84
19/11/2008
289.25
1998.02
19/12/2008
321
2141.1
19/01/2009
332.5
2061.15
19/02/2009
336.75
2019.72
19/03/2009
308.5
1931.04
19/04/2009
311.5
2096.6
19/05/2009
346
2285.23
19/06/2009
317.25
2211.91
19/07/2009
316
2239.52
19/08/2009
313.2
2405.57
19/09/2009
335.1
2658.01
19/10/2009
330.1
2715.26
19/11/2009
331.9
2695.15
19/12/2009
316
2653.36
19/01/2010
339.5
2815.68
19/02/2010
333.4
2741.54
19/03/2010
333.1
2891.94
19/04/2010
344.8
2940.74
19/05/2010
323
2662.27
19/06/2010
331.7
2711.62
19/07/2010
346.4
2658.05
0.028483 0.076347 0.036857 0.060362 0.038583 -0.00548 0.063686 0.180771 0.086299 -0.04847 0.049057 0.044964 0.018933 -0.12078 0.064361 0.050542 -0.29897 0.042892 -0.0611 -0.04506 -0.1481 0.167692 -0.03491 -0.11945 -0.07442 0.09464 0.133129 -0.32343 0.154691 0.109767 0.035826 0.012782 -0.08389 0.009724 0.110754 -0.08309 -0.00394 -0.00886 0.069923 -0.01492 0.005453 -0.04791 0.074367 -0.01797 -0.0009 0.035125 -0.06323 0.026935 0.044317
0.023507033 0.023396818 -0.006047863 0.056005713 0.011079471 0.006791486 0.007023234 0.034635896 -0.036026652 0.038736221 0.031220387 -0.003762657 -0.000861289 -0.088760102 0.060844303 0.01081537 -0.065360256 0.017984981 -0.059150782 0.016543922 -0.06958578 0.087762035 0.049649521 -0.104057987 -0.05858629 -0.009131051 -0.000649269 -0.24294753 -0.0257553 0.071610895 -0.037340619 -0.020100429 -0.043907076 0.085736184 0.089969474 -0.032084298 0.012482425 0.074145353 0.104939786 0.02153867 -0.007406289 -0.01550563 0.061175265 -0.026331117 0.054859677 0.016874486 -0.094693853 0.018536813 -0.019755718
19/08/2010
356.9
2690.81
19/09/2010
385.4
2844.71
19/10/2010
383.1
2947.99
19/11/2010
366.8
2959.82
19/12/2010
372.1
3044.15
19/01/2011
380.8
3103.83
19/02/2011
384
3154.1
19/03/2011
351
2973.64
0.030312 0.079854 -0.00597 -0.04255 0.014449 0.023381 0.008403 -0.08594
0.012324825 0.057194674 0.036305985 0.004012904 0.028491597 0.019604816 0.016196119 -0.057214419
APPENDIX 1.3b REGRESSIONANALYSIS SUMMARY OUTPUT Regression Statistics Multiple R 0.393155 R Square 0.154571 Adjusted R Square 0.151625 Standard Error 0.07044 Observations 289 ANOVA
Regression Residual Total
Intercept X Variable 1
Significance df SS MS F F 1 0.260358339 0.260358 52.47244 4.03E-12 287 1.424039673 0.004962 288 1.684398012 Standard Coefficients Error t Stat P-value 0.001231 0.004166711 0.295457 0.767858 0.618599 0.085397227 7.243787 4.03E-12
Upper Lower 95% 95% -0.00697 0.009432 0.450515 0.786684
Lower 95.0% -0.00697 0.450515
Rf (given)
equity beta x Mkt risk
Calculation: cost of equity, ke CAPM
4.20% ke
equity beta 0.618599293
Mkt risk 0.0546
0.033776
7.58% Share Price 19th 2011
Issued Shares £3.51
1872millions
Market value of ordinary shares: £351x1872 million = £6570.72 million Net financial obligation
= £ 2215 million
Upper 95.0% 0.009432 0.786684
APPENDIX 2.1 COMMON SIZE AND TREND ANALYSIS FOR SAINSBURY’S IN PERCENTAGE 2008 £m
2008 £m
2009 £m
2009 £m
2010 £m
2010 £m
2011 £m
2011 £m
Operating Income 100
Revenue Cost of sales
-0.94
istrative Expenses Operating Income from Sales (before tax)
-0.03
Tax on Ordinary Activities
106.0212 -94.52
-0.97
-2.22
99.03
111.9247 -94.5802
-96.7426
-2.00
3.257363
118.3046 -94.5029
-96.5788
-1.98
3.42
3.52
-0.01
-0.94
-0.74
-0.89
Tax on Other Income
0.00
0.08
0.04
0.14
Tax on Financial Items
0.00
-0.14
-0.16
-0.11
Total Operating Tax Operating Income from Sales (After tax) Other Operating Income (before tax)
-0.01
-0.99
-0.86
-0.85
0.02
-0.01
0.00
0.00
Other Income
0.00
0.30
0.14
0.51
Less: Tax Share of Post-Tax loss from t Ventures Other Operating Income (After tax) Dirty Surplus Items of Operating Activities Actuarial gains on defined benefit pension schemes Less Tax impact on above item
0.00
-0.08
-0.04
-0.14
0.00
-0.59
0.69
0.28
Operating Income
-96.479
0.00
-0.37
0.79
0.65
0.03
-4.77
-0.87
0.14
-0.01
1.34
0.24
-0.01
0.04
-3.81
0.16
0.77
Less: Financing expense (income): Finance expense
-0.01
-0.78
-0.74
-0.54971
Finance Income
0.00
0.27
0.17
0.15
0.00
-0.51
-0.58
-0.40
0.00
0.14
0.16
0.11
Less: Tax benefit
0.00
-0.36
-0.41
-0.29
Dirty Surplus Items of Financial Activities: Available-for-sale financial assets: Group Available-for-sale financial assets: t ventures Cash flow hedge: Group
0.00
-0.08
0.22
0.07
0.00
-
0.00
0.05
Cash flow hedge: t Venture
0.00
-0.17
Share based payment Less: Tax on the above components of other comprehensive income Comprehensive Income to Ordinary Shareholders
0.00 0.00
0.00
0.02
-0.5
0.12
0.01
-0.02
-0.04
-
0.01
-
-
-0.06
-0.15
-0.01
-0.25
0.04
-2.1
2.57
3.19
0.04
-2.1
2.57
3.19
APPENDIX 2.2a SAINSBURYS REFORMATED INCOME STATEMENT FOR THE PERIODS 2008 – 2011 2008
2008
2009
2009
2010
2010
2011
2011
£m
£m
£m
£m
£m
£m
£m
£m
Operating Income Revenue Cost of sales istrative Expenses
17837 -16835 -502
Operating Income from Sales (before tax) Tax on Ordinary Activities Tax on Other Income Tax on Financial Items
18911 -17875
-17337
-420
500
19964 -18882
-18295
-399
616
21102 -19942
-19281
-417
683
743
-150
-177
-148
-187
9
16.074
7.56
30.24
-14.7
-27.072
-32.2
-23.52
Total Operating Tax Operating Income from Sales (After tax)
-20359
-155.7
-187.998
-172.64
-180.28
344.3
428.002
510.36
562.72
Other Operating Income (before tax) Other Income
30
57
27
108
Less: Tax
-9
-16.074
-7.56
-30.24
Share of Post-Tax loss from t Ventures Other Operating Income (After tax)
-2
-111
138
60
Dirty Surplus Items of Operating Activities Actuarial gains on defined benefit pension schemes Less Tax impact on above item Operating Income
19
-70.074
157.44
137.76
542
-903
-173
29
-151
253
48
-3
754.3
-292.072
542.8
726.48
Less: Financing expense (income): Finance expense Finance Income Less: Tax benefit
-132
-148
-148
83
52
33
-116
-49
-96
-115
-84
14.7
27.072
32.2
23.52
-34.3
-68.928
-82.8
-60.48
-31
-16
43
14
24
2
-3
-8
32
Dirty Surplus Items of Financial Activities: Available-for-sale financial assets: Group Available-for-sale financial assets: t ventures Cash flow hedge: Group
-
48 2
Cash flow hedge: t Venture
-58
Share based payment Less: Tax on the above components of other comprehensive income Total Comprehensive Income(to Ordinary Shareholders)
-10 -1
9 -
-32 -84.3
2
4
-103.928
-11
-29.8
-3
-53.48
670
-396
513
673
670
-396
513
673
APPENDIX 2.2b TESCO'S REFORMATED INCOME STATEMENT FOR THE PERIODS 2008 – 2011 2008
2008
2009
2009
2010
2010
2011
2011
£m
£m
£m
£m
£m
£m
£m
£m
Operating Income Revenue Cost of sales istrative Expenses
47298
54327
56910
60931
-43668
-50109
-52303
-55871
-1027
-1248
-1527
-1676
Operating Income from Sales (before tax)
-44695
-51357
-53830
-57547
2603
2970
3080
3384
Tax on Ordinary Activities
-673
-788
-840
-864
Tax on Other Income
56.4
105.56
119.56
Tax on Financial Items
-18.9
66.55 102.08
Total Operating Tax Operating Income from Sales (After tax)
-87.92
-93.24
-635.5
-823.53
-822.36
-837.68
1967.5
2146.47
2257.6
2546.32
Other Operating Income (before tax) Profit arising from Property-related items Less: Tax
188
236
377
427
-56.4
-66.55
-105.56
-119.6
Loss from operating activities Share of post-tax profits of t ventures and associates Other Operating Income (After tax)
75
110
33
57
206.6
279.45
304.44
364.44
38
-275
343
-344
187
-629
-322
595
54
-153
Dirty Surplus Items of Operating activities Foreign currency translation differences Total gain/Loss on defined benefit pension scheme Tax relating to Components of other C.Income Tax on item taken directly to equity
123
Total Other operating Income Operating Income
435 554.6
-189.55
379.44
462.44
2522.1
1956.92
2637.1
3008.76
Less: Financial Expense Finance cost Finance Income Less: Tax
-250
-478
-579
-483
187
116
265
150
-63
-362
-314
-333
18.9
-44.1
102.08
33
-259.92
87.92
-226.08
93.24
-239.76
Dirty Surplus Items of Financing activities Change/Loss on revaluation of available-for-sale investments Reclassified and reported in Group Income Statement
-4
3
1
-29
5
Fair value Movements of Cash flow hedges
66
-334 505
Total Comprehensive Income Minority Interest Comprehensive Income to ordinary shareholders
174
-168
2 8 -162
-22
-12
2511
1871
2249
2757
-11
-1
-27
-11
2500
1870
2222
2746
APPENDIX 2.3a SAINSBURY’S REFORMULATED GROUP BALANCE SHEET FOR THE PERIOD 2009-2012
2008 £m
2008
2009 £m
£m
2009 £m
2010 £m
2010 £m
2011 £m
2011 £m
Operating Assets (OA) Property Plant and Machinery
7424
7821
8203
8784
Intangible Assets
165
160
144
151
Investment in t Venture
148
288
449
502
55
45
36
36
Other Receivables Retirement Benefit Assets
495
Inventories
681
-
-
Non-current assets held for sale
112
21
56
13
Trade and Other Receivables
206
195
215
343
Cash and cash equivalents
719
689
10005
627
702
9846
837
812
10642
501
11142
Less: Operating Liabilities (OL) Trade and other payables
2280
2488
2466
2597
Current Provisions
10
19
13
11
Non-current Provisions
63
57
66
62
Taxes Payable
191
202
200
201
Other Payables
89
92
106
120
321
95
144
172
Deferred income tax liability Retirement benefit obligation
-
2954
Net Operating Assets(NOA)
309
7051
3262
421
6584
3416
340
7226
3503 7639
Financial Assets (FA) Available for Sales Non-current derivative financial instruments Current derivative financial instruments
Less: Financial Obligations (FO) Current Derivatives Financial Instrument liabilities Non-Current Derivatives Financial Instrument liabilities Borrowings: amount falling due within 1 year Borrowings: amount falling due after more than 1 year
106 4
97
150
176
31
20
29
59
43 187
213
257
7161
6771
7439
7896
6
56
41
18
8
2
118
154
73
2084
52
110
2226
Net Financial Obligations (NFO)
2116
Non- Controlling Interest (NCI)
-
Common Shareholders' Equity (CSE)
4935
2177
2395 2208 4376
2357
59 74 2473
2339
2472
2260
2215
-
-
4966
5424
APPENDIX 2.3b TESCO PLC REFORMULATED GROUP BALANCE SHEET 2008 2008 £m £m Operating Assets (OA) Goodwill and other Intangible Assets Property, Plant and Equipment Investment Property Investment in t Ventures and Associates Other Investments Deferred tax assets Inventories Trade and Other Receivables Current Tax Assets Cash Less: Operating Liabilities (OL) Trade and other payables Customer Deposits Current Tax liabilities Non-current Provision Current Provision Post-employment benefit Obligation Deferred tax Liabilities Other non-current payables Deposits by banks Net Operating Assets (NOA) Financial Assets (FA) Non-Current Derivative Financial InstrumentsAssets Current Derivative Financial InstrumentsAssets Non-Current Loans and Advances to customers Current Loans and Advances to customers Current Loans and Advances to banks and other financial assets Short-term Investments Cash and Cash equivalents Non-current assets classified as held for sale Less: Financial Obligations Borrowings: amount falling due within 1 year Borrowings: amount falling due after more than 1 year Current Derivative Financial Instruments- and other Liabilities Liabilities of the disposal group classified as held for sale Non-Current Derivative Financial Instrumentsand other Liabilities Net Financial Obligation (NFO) Non-Controlling Interests Common Shareholders' Equity (CSE)
2336 19787 1112 305 4 104 2430 1311 6 1542
28937
7277 455 23 4 838 802 42 9441 19496
2009 2009 2010 2010 £m £m £m £m 4027 23152 1539 62 259 21 2669 1798 9 2112
8522 4538 362 67 10 1494 696 68 24
35648
15781 19867
4177 24203 1731 152 863 38 2729 1888 6 2062
9442 4357 472 172 39 1840 795 30
37849
17147 20702
2011 2011 £m £m 4338 24398 1863 316 1108 48 3162 2314 4 1785
10484 5074 432 113 64 1356 1094 36
216
1478
1250
1139
97
382 1470 1918
224 1844 2268
148 2127 2514
2129 1233 1397 398
144 1314 757 373
404 1022 85 431
360 246 308
1227 20723
10405 30272
8174 28876
2084
4059
1529
1386
5972
12391
11744
9689
443
525
146
255
-
-
322
8821 11902 87 11815
302
17277 12995 57 12938
776
14195 14681 85 14596
600
39336
18653 20683
7870 28553
11930 16623 88 16535
APPENDIX 3.1a SAINSBURY'S REFORMATED CASHFLOW STATEMENT FOR THE PERIODS 2008- 2011 2008 £m
2008
2009
£m
£m
2009
2010
£m
£m
2010
2011
£m
£m
2011 £m
Cash from Operating Activities ( C ) Cash generated from operations Corporation Tax paid Tax on Interest
998
1206
-64 -28.2
1206
-160 -92.2
Dividend Received
-
-32.43
-89 -192.43
905.8
3
905.8
Cash Investments (I) Acquisition of and investment in Subsidiaries
1138
-26.04
-158 -115.04
1016.57
-28.89
2
-186.89
1092.96
1016.57
1
1092.96
952.11
-7
-10
-973
-966
-1036
-1136
Proceeds from disposal of PPE & other Assets
198
390
139
282
Proceeds from Sale of Intangible Asset
-
-
Purchase of PPE
Purchase of intangible assets
-6
Invested in t ventures and associates
-31
Cost of disposal of Operations
-1
Free Cash Flow C - I
-
-
-15
-2 -887
85.8
-
-11
-291 -820
-1
-10
952.11
-
129.57
-2 -910
-872
182.96
80.11
Financial Flow to Claimants (F) Interest Paid
123
128
111
126
Interest Received
-29
-13
-18
-19
94
115
93
107
Tax On Interest
-28.2
65.8
Investment in Financial Assets
-
Repayments of Long-term Borrowing
-32.43
82.57
36
30
74
61
3
3
3
4
2
3
-235
-45
Proceeds from Long-term borrowing
-
-152
Proceeds from Short-term borrowing
-
-43
Repayments of Short-term Borrowing
-164
Total Debt Financing
-43
Dividends Paid
178
-
-59.2
-2
-73.43
145 85.8
235
-73.43
-15
10
36
-59.2
Equity Financing (d) Proceeds from Issuance of ordinary shares
Total Financing Flow (F+d)
78.11 50
-
Total Equity Financing
-28.89
10
-
Capital Redemption
66.96
8
Interest elements of Obligations under Finance Leases payments Repayment of capital element of obligations under finance lease payment
Increase/Decrease in Cash
-26.04
11 191.96
-334
191.96
-171.89
-250
218
241
-
-
-17 269 -
203 129.57
-171.89
-9 182.96
252 80.11
APPENDIX 3.1b TESCO'S REFORMATED CASHFLOW STATEMENT FOR THE PERIODS 2008- 2011 2008 £m
2008 £m
2009 £m
2009
2010 £m
£m
2010 £m
2011 £m
2011 £m
Cash from Operating Activities ( C ) Cash generated from operations
4099
Corporation Tax paid
-346
Tax on Interest
-84.6
Dividend Received Effect of foreign exchange rate changes
4978
5947
-456 -430.6
-133.104
-589.104
88 -55
5366
-512 -170.52
-760 -682.52
69 3701.4
120
3701.4
-136.08
-896.08
35 4577.896
49
4577.896
62 5348.48
-46
5348.48
4485.92 4485.92
Cash Investments (I) Acquisition of Subsidiaries Proceeds from sale of t ventures and associates
-169
-1275
-
Proceeds from sale of subsidiary
-
Purchase of PPE and Investment Property Proceeds from sale of PPE Proceeds from Sale of Intangible Asset
-
-
-
-
-
-
-4487
-2855
-3178
1056
994
1820
1906
4
3
-220
-163
-373
-
-158
Invested in t ventures and associates
-61
Free Cash Flow C - I
-2774
-30
927.4
Financial Flow to Claimants (F) Increase in loans to t ventures
-89
-3442 -
Purchase of intangible assets
-65
-5018
-4
-440.104
-1263
-174
4085.48
36
242
45
219
360 -
1233
1918
1264
Decrease in loans to t ventures
-25
Investments in short-term investments Proceeds from sale of short-term Investments Interest Paid Interest Received Tax On Interest Increase in borrowings Repayments of Borrowing New Finance Leases Repayments of Obligations under Finance Leases Increase/Decrease in Cash
-360
410
-1233
562
-1314
690
614
-128
-90
-81
-128
282
472
609
486
-84.6
197.4
-133.104
338.896
-170.52
438.48
-136.08
349.92
-9333
-7387
-862
-2175
7593
2733 -
3601
4153
-119 32 746
Total Debt Financing Equity Financing (d) Ordinary shares issued for cash
-
18 -487.6
1721
-487.6
-138
41
-1461.104
-690
-1461.104
42 3258.48
-949
3258.48
-130
-167
-
-
-98
-16
Dividends Paid
792
883
968
1081
2
3
2
2
Own Shares Purchased Other Adjustments Total Equity Financing Total Financing Flow (F+d)
775 -
265
-
24
-
1564.92 1564.92
Proceeds from sale of ordinary share capital to minority interests Dividends Paid to Minority Interest
-1905 2580.92
31
-
-
1415
1021
827
1016
927.4
-440.104
4085.48
2580.92
APPENDIX 3.2a ANALYST FORECAST AND MY PREDICTIONS RBS
Evolution Security PLC
Own Outcome
Santander
2012
2012
2012
2012
2012
2012
2012
2012
£m
£m
£m
£m
£m
£m
£m
£m
Operating Income Revenue
22540
Cost of sales
22085
-21301
istrative Expenses Operating Income from Sales (before tax)
-445.417
Tax on Ordinary Activities
-199.743
-21746.368
-436.425
793.63
Tax on Other Income Tax on Financial Items
22325.6
-20871
22007.67
-21098.3 -21307.3886
-441.18
777.61
-20797.88 -21539.52
-434.90
786.08
-195.711
774.89
-197.843
-195.03
29.99
29.39
29.71
29.29
-23.3283
-22.8574
-23.11
-22.78
Total Operating Tax Operating Income from Sales (After tax)
-21232.78
-193.08
-189.18
-191.24
-188.52
600.55
588.43
594.84
586.37
Other Operating Income (before tax) Other Income Less: Tax Share of Post-Tax loss from t Ventures
115.3597
113.031
114.2624
112.64
-29.99
-29.39
-29.71
-29.29
64.09
62.79
63.48
62.58
Other Operating Income (After tax) Dirty Surplus Items of Operating Activities Actuarial gains on defined benefit pension schemes Less Tax impact on above item Operating Income
149.45
146.44
148.03
145.93
30.98
30.35
30.68
30.24
8.05
7.89
7.98
7.86
789.04
773.11
781.53
770.40
Less: Financing expense (income): Finance expense Finance Income
Less: Tax benefit Dirty Surplus Items of Financial Activities: Available-for-sale financial assets: Group Available-for-sale financial assets: t ventures Cash flow hedge: Group Cash flow hedge: t Venture Share based payment Less: Tax on the above components of other comprehensive income Total Comprehensive Income(to Ordinary Shareholders)
-123.905
-121.404
-122.73
-120.98
34.18
33.49
33.86
33.37
-89.72
-87.91
-88.87
-87.61
23.33
22.86
23.11
22.78
-66.40
-65.06
-65.76
-64.83
14.95
14.65
14.81
14.60
2.14
2.09
2.12
2.09
-8.55
-8.37
-8.46
-8.34
2.14
2.09
-
2.12
2.78
-52.94
2.09
2.72
-51.87
2.75
-52.43
-3.13
-57.53
736.10
721.24
729.10
712.88
736.10
721.24
729.10
712.88
APPENDIX 3.2b SAINSBURY’S 2012 ACTUAL OUTCOME ACTUAL OUTCOMES 2012 2012 £m £m Operating Income 22294
Revenue
-21083 -419
Cost of sales istrative Expenses
Operating Income from Sales (before tax)
-21502 792
-201 21.32 -26.78
Tax on Ordinary Activities Tax on Other Income Tax on Financial Items
-206.46 585.54
Total Operating Tax
Operating Income from Sales (After tax) Other Operating Income (before tax) 82 -21.32 28
Other Income Less: Tax Share of Post-Tax loss from t Ventures
Other Operating Income (After tax) Dirty Surplus Items of Operating Activities
88.68
Actuarial gains on defined benefit pension schemes
-222 68 520.22
Less Tax impact on above item
Operating Income Less: Financing expense (income): Finance expense
-138 35 -103 26.78 -76.22
Finance Income Less: Tax benefit
Dirty Surplus Items of Financial Activities: Available-for-sale financial assets: Group
1 2
Available-for-sale financial assets: t ventures Cash flow hedge: Group
-
Cash flow hedge: t Venture Share based payment Less: Tax on the above components of other comprehensive income
Total Comprehensive Income(to Ordinary Shareholders)
2 2
-69.22 451 451
APPENDIX 4.1a Ratio analysis for Sainsbury's: Ratios (Level 3)
2008
Asset Turnover (ATO) Drivers: PPE Turnover Inventory Turnover Receivable Turnover Other Asset Turnover Payable Turnover Other Liabilities Turnover 1/ATO
2009
0.42 0.04 0.01 0.09 0.13 0.04 0.40
0.41 0.04 0.01 0.06 0.13 0.04 0.35
2010
0.41 0.04 0.01 0.08 0.12 0.05 0.36
2011
0.42 0.04 0.02 0.06 0.12 0.04 0.36
APPENDIX 4.1b Ratio analysis for TESCO PLC: Ratios (Level 3)
2008
2009
2010
2011
Asset Turnover (ATO) Drivers:
PPE Turnover Inventory Turnover s Receivable Turnover Other Assets Turnover s Payable Turnover Other Liability Turnover 1/ATO
0.42 0.05 0.03 0.12 0.15 0.05 0.41
0.43 0.05 0.03 0.26 0.16 0.14 0.47
0.43 0.05 0.03 0.24 0.17 0.15 0.44
0.40 0.05 0.04 0.25 0.17 0.14 0.42
12 January 2011
Price/Target:
390p/350p
Mkt Cap:
£7,470m
Net Cash/(Debt) (FY1)
Mar
2010A
PBT EPS (p) DPS (p) P/E (x)
-£2,706m
2011E
2012E
610
654
727
23.3
25.1
27.0
14.2
15.3
16.6
16.8x
15.5x
14.4x
600
Sainsburys
Reduce
(SBRY.L)
What lies beneath On the surface, headline Q3 LFL sales growth of 3.6% appears attractive. But, the underlying figures are much less impressive, reflect the industry slowdown and suggest that momentum is slowing. Most noticeably, the substantial extension program and last January’s VAT rise are clouding the underlying trends. Stripping out these impacts, reported 3.6% expetrol LFLs would fall to c1.5%, suggesting flattish volumes. With underlying growth unimpressive, margin expansion limited and the industry outlook deteriorating, we see no reason why Sainsbury’s should command a 20% 2012 PE to the sector. We urge caution and rate the stock a Reduce with a 350p target price.
550 500 450 400 350 300 250 200 Jan 06 Jul 06 Jan 07 Jul 07 Jan 08 Jul 08 Jan 09 Jul 09 Jan 10 Jul 10 Jan 11 Source: FactSet Estimates
Price
Price Relative to FTSE 100
Results: Sainsbury’s delivered total sales growth of +7.5% slightly shy of our +8% estimate. Excluding petrol, total sales growth of 6.0% was also a touch behind our 6.5% forecast. LFLs of +3.6% were broadly in line. Although 3.6% headline growth appears higher than Morrisons 1%, we note that on the same definition, the growth rates are broadly similar.
Extension impact: With over 300k sq ft of extensions in this quarter (550k year to date), the underlying LFL picture is clouded by the inclusion of this additional space in LFLs. Sainsbury’s explained this extra space contributed c1% to growth. Last quarter extensions contributed 0.3% to LFL sales and going forward the impact will be even greater than the c1% reported today.
Industry outlook: Management were unequivocal in explaining the pervasive impact of inflation and on their concerns for the consumer outlook. They echoed Kantar in talking about a boost to non-food sales over Christmas as consumers moved away from the High Street due to accessibility and the adverse weather. This shift could cloud the underlying picture and see January sales disappoint as consumers revert back to the High Street.
Valuation: With industry concerns mounting and growth rates weaker than management suggest, Sainsbury’s 20% 2012 PE cannot be justified on fundamentals. We do not expect corporate activity to emerge and consequently, the balance of risk lies firmly to the downside. Reduce, 350p target price.
Dave McCarthy
Year End Mar Sales (£m) EBITDA (£m) EVO PBT (£m) EPS (p) DPS (p) Growth PBT (%) Growth EPS (%) P/E (x) EV/Sales (x) EV/EBITDA (x) Yield (%)
2008A 17,837 1,016 434 16.0 12.0 +28% +32% 24.4x 0.5x 9.0x 3.1%
2009A 18,911 1,084 519 20.5 13.2 +20% +28% 19.1x 0.5x 8.6x 3.4%
2010A 19,964 1,150 610 23.3 14.2 +18% +14% 16.8x 0.5x 8.4x 3.6%
2011E 21,047 1,263 654 25.1 15.3 +7% +8% 15.5x 0.5x 8.1x 3.9%
+44 (0)20 7071 4715 [email protected]
Andrew Porteous +44 (0)20 7071 4441 [email protected]
The company has reviewed a draft of this research note and factual changes have been made
EVO Securities makes markets in Sainsburys This publication was produced by Evolution Securities Limited (ESL). This publication is disseminated in the EEA by ESL. This publication is disseminated in the US by Evolution Securities US (ESUS); it has not been altered in any way by ESUS prior to distribution. ESUS is a wholly owned subsidiary of ESL. Under the Markets in Financial Instruments Directive and the Financial Services Authority’s Conduct of Business Rules, this document is a marketing communication and has not been prepared in accordance with legal requirements designed to promote the independence of investment research. Although it is not subject to any legal requirement prohibiting dealing ahead of the dissemination of investment research, Evolution Securities Ltd upholds this standard through its internal systems and controls.
2012E 22,085 1,359 727 27.0 16.6 +11% +8% 14.4x 0.5x 7.8x 4.2%
Produced by: The Royal Bank of Scotland N.V.
12 January 2011
Hold Target price
£3.70 Price
£3.90
Equity | United Kingdo m| Food & Drug Retailer s
Sainsbury (J) Good 3Q sales - as expected Sainsbury reported a good 3Q11 sales performance although this had been expected. The trading and consumer environment is likely to remain challenging in 2011 but we believe that Sainsbury's business model (just like its UK peers), is strong enough to cope and to grow.
Sainsbury has reported 3Q11 sales covering the 14 weeks to January 8 with total sales up by 7.5% or by 6% excluding fuel. Lfl sales growth inc fuel was +5.4% but ex fuel and inc VAT lfl grew by 3.6%, which compares to our forecast of 4%. We believe that ex VAT (80bp) and adjusting for the extra week of trading in the quarter (30-40bp), lfl ex fuel and ex VAT rose by 2.3-2.4%.
Extensions are likely to have contributed at least 50bp to the lfl sales performance.
New space contributed 2.4% to sales growth (ex fuel) which compares to our 2.5% forecast.
Total Non-Food sales grew at three times the rate of food and we estimate that this means that Non-Food grew sales by c15% and Food by 5%. Seasonal, Clothing, Home, Electrical and entertainment all contributed strongly to the non-food growth rate while at the same time Sainsbury's Online and Convenience businesses 'continued to perform well'.
The outlook statement is as we had expected, with Sainsbury being 'well placed to make continued good progress in 2011' despite the challenging consumer environment. We like Sainsbury and we are positive on the continued development of its business model and indeed, we forecast FY10-FY13 EPS CAGR of 10% and over the same period, and despite over £3bn of capex forecast by us, we expect after-tax ROIC to increase by 90bp from a lowly 6.8% in FY10 to 7.7% by FY13. Thus, while we forecast annual incremental after-tax returns of 12-13%, our FY13 ROIC is still just close to Sainsbury's cost of capital.
We changed our recommendation on the shares from Buy to Hold in September 2010 as the share price had achieved our 370p price target. One area where our forecasts could be wrong is the in-store EBIT margin, which we currently forecast to rise by 60bp between FY10-FY13 and to put this into context, each incremental 10bp on top of our FY13F in-store EBIT margin is worth on an NPV basis, around 8p per share to our valuation.
With the shares trading on a CY11F PE and EV/EBITDAR of 13.9x and 9.3x respectively, we do not see much, indeed if any, near-term scope for further multiple expansion. these valuations compare to Morrison's trading on 11.0x and 6.4x and Tesco on 11.8x and 8.5x respectively.
Analysts Justin Scarborough
The conference call starts at 8.45am.
+44 20 7678 0748 [email protected] 250 Bishopsgate, London, EC2M 4AA, United Kingdom http://research.rbsm.com
Important disclosures can be found in the Disclosures Appendix.
Income statement £m
FY09A
FY10A
FY11F
FY12F
FY13F
Revenue Cost of sales Operating costs EBITDA DDA & Impairment (ex gw) EBITA Goodwill (amort/impaired) EBIT Net interest Associates (pre-tax) Other pre-tax items Reported PTP Taxation Minority interests Other post-tax items Reported net profit Tot normalised items Normalised EBITDA Normalised PTP Normalised net profit
18911 -14577 -3250 1084 -468.0 616.2 n/a 616.2 -89.0 15.7 -77.0 465.9 -177.0 0.00 0.00 288.9 -79.0 1084 518.9 367.9
19964 -15372 -3442 1150 -479.0 671.0 n/a 671.0 -103.4 18.4 147.0 733.1 -148.3 0.00 0.00 584.8 148.8 1150 610.1 436.0
21320 -16484 -3591 1246 -492.7 753.1 n/a 753.1 -99.7 20.7 26.4 700.4 -210.1 0.00 0.00 490.3 21.6 1246 671.1 468.7
22540 -17396 -3778 1365 -520.0 845.5 n/a 845.5 -95.3 23.9 28.9 803.1 -240.9 0.00 0.00 562.2 28.2 1365 766.7 533.9
23793 -18333 -3989 1471 -548.0 922.7 n/a 922.7 -89.5 27.5 33.7 894.3 -268.3 0.00 0.00 626.0 37.4 1471 848.2 588.6
Source: Company data, RBS forecasts
year to Mar
Balance sheet £m Cash & market secs (1) Other current assets Tangible fixed assets Intang assets (inclgw) Oth non-curr assets Total assets Short term debt (2) Trade &oth current liab Long term debt (3) Oth non-current liab Total liabilities Total equity (incl min) Total liab&sh equity Net debt
FY09A
FY10A
FY11F
FY12F
FY13F
627.0 964.0 7821 191.0 430.0 10033 210.0 2709 2185 553.0 5657 4376 10033 1768
837.0 1016 8203 164.0 640.5 10860 114.0 2679 2359 742.5 5894 4966 10860 1636
837.0 1150 8654 151.0 635.0 11427 114.0 2835 2532 757.6 6238 5189 11427 1809
837.0 1223 9073 138.0 649.4 11921 114.0 2985 2559 801.1 6459 5462 11921 1836
837.0 1298 9467 125.0 648.8 12376 114.0 3139 2530 832.4 6615 5761 12376 1807
Source: Company data, RBS forecasts
year ended Mar
Cash flow statement £m EBITDA Change in working capital Net interest (pd) / rec Taxes paid Other oper cash items Cash flow from ops (1) Capex (2) Disposals/(acquisitions) Other investing cash flow Cash flow from invest (3) Incr / (decr) in equity Incr / (decr) in debt Ordinary dividend paid Preferred dividends (4) Other financing cash flow Cash flow from fin (5) Forex& disc ops (6) Inc/(decr) cash (1+3+5+6) Equity FCF (1+2+4)
Lines in bold can be derived from the immediately preceding lines. Source: Company data, RBS forecasts
Sainsbury (J) | Key Financial Data | 12 January 2011
FY09A
FY10A
FY11F
FY12F
FY13F
1084 163.0 -115.0 -160.0 16.0 988.2 -976.0 81.0 n/a -895.0 18.0 169.0 -218.0 n/a 0.00 -31.0 -61.0 1.19 12.2
1150 89.0 -93.0 -89.0 -6.00 1051 -1047 103.0 n/a -944.0 252.0 78.0 -241.0 n/a 0.00 89.0 3.90 199.9 4.02
1246 21.5 -99.0 -210.1 66.9 1025 -1005 77.0 n/a -928.2 0.00 172.7 -267.4 n/a 0.00 -94.8 0.00 2.00 19.8
1365 77.5 -93.7 -240.9 80.5 1189 -1007 82.1 n/a -924.9 0.00 27.6 -289.5 n/a 0.00 -261.9 0.00 2.00 181.9
1471 78.6 -84.8 -268.3 88.2 1284 -1013 86.9 n/a -926.4 0.00 -29.5 -326.5 n/a 0.00 -356.0 0.00 2.00 271.1
year to Mar
European Equity Research – FLASHNOTE
United Kingdom – Food & Drug Retailers January 12, 2011
SAINSBURY
HOLD CURRENT PRICE: GBP390 TARGET PRICE: GBP400
Solid 3Q10 Sales Jaime Vázquez
Borja Olcese
(+34) 91 289 5436 [email protected]
(34) 91 289 1853 [email protected]
Sainsbury has published good 3Q sales but already anticipated by the strong Kantar numbers yesterday. This period covers 14 weeks to Jan 8 and therefore numbers are not fully comparable with Morrison’s or Tesco’s as the trading periods differ (the latter two are for six weeks only). LFL ex-fuel but including VAT (and IFRIC 13 compliant) reached 3.6% or 2.8% ex-VAT, compared to Morrison’s published 1.0% ex-VAT. However, Morrison faced comps 220bp tougher while Sainsbury’s base was 90bp easier than in the preceding period. In fact, the two-year ex-VAT growth rate has decelerated slightly from 7.7% in 2Q to 7.0% in 3Q while Morrison’s accelerated from 5.6% in 3Q to 7.5% in the Christmas period. Sainsbury’s LFL includes to a much greater extent than Morrison’s the benefit of more space opened the year before maturing and the benefit of extensions (90bp). Inflation is seen at 1.5-2.0% in the quarter, up c50bp from 2Q.
New space contribution: 2.4% after 2.3% in 2Q. This compares with Morrison’s 2.1% with less space growth, the reason being that about 40% of the new space is devoted to lower density non-food business. The company reiterates its FY new space guidance of 1.5mn sq ft. Non-food growth was three times that of food, driven by openings and store extensions, which is the medium-term aspiration for the company to justify the investment. The company did not provide an indication of pure LFL growth. Guidance: management sees no basis for consensus to move estimates up from the current PBT of GBP660mn. We are not changing our GBP665mn estimate. Recommendation: Sainsbury has best-in-class management, in our view, and very strong trading momentum which we believe is sustainable as there is plenty to catch up with on food sales densities and also as non-food is being successfully rolled out in stores being extended. Top line momentum is key as operational leverage is high (low EBIT margin, low sales densities). The valuation , however, relative to Morrison looks excessive to us. The stock trades on 8.9x lease adj 2011E EV/EBITDAR vs Morrison’s 6.4x and Tesco’s 7.6x. The capitalisation of leases under proposed new ing rules in a couple of years’ time should make this valuation gap more visible to the market. Reiterate Hold.
Company Data, January 11, 2011 Sales (GBP mn) EBITDA (GBP mn) EPS P/E (x) EV/EBITDA (x) GDY (%)
2009/10 19,964.0 1,150.0 24.99 15.6 7.8 3.48
2010/11E 20,943.0 1,226.0 25.98 15.0 7.6 3.37
2011/12E 22,325.6 1,324.0 27.69 14.1 7.3 3.57
2012/13E 23,701.7 1,442.4 30.98 12.6 6.9 3.89
Reuters/Bloomberg codes Market cap. (GBP mn) Number of shares (mn) Free float (%) Av. daily volume (GBP mn) 52-week range (GBp) 4Q sales due
Source: Company data and Santander Investment Bolsa estimates.
US investors’ enquiries should be directed to Santander Investment Securities Inc. (SIS) at (212) 692-2550. US recipients should note that this research was produced by a non-member of SIS and, in accordance with NASD Rule 2711, limited disclosures can be found on the back cover.
SBRY.L / SBRY LN 7,433.0 1,903.9 60.0 18.82 356-395 23 March
References BBC, (2012).UK recession deepens after 0.7% fall in GDP. [Online] Available at http://www.bbc.co.uk/news/business-18977084 [Accessed on 22nd December, 2012] Datamonitor 360 (2012). [e-library]. Available through University of Birmingham Library Website: http://advantage.marketline.com.ezproxyd.bham.ac.uk/Product?pid=34972414-9A41-4048A7B6-1B0017054743 Farnham J. (2009). Recession bites into eating habits. [Online] Available at http://news.bbc.co.uk/1/hi/business/8124352.stm. [Accessed on 10th December, 2012] HouseWeb, (2012) UK Interest Rate. [Online] Available at http://www.houseweb.co.uk/house/market/irfig.html [Accessed on 17 Dec 2012] Investopedia, (2012).Definition of 'Current Ratio’.[Online] Available at http://www.investopedia.com//c/currentratio.asp#ixzz2FQLUlPGa [Accessed
on 18th December, 2012] Investopedia, (2013a). Valuing A Company Using The Residual Income Method. [Online] Available at http://www.investopedia.com/articles/fundamental-
analysis/11/residual-income-model.asp#axzz2H49nREtB [Accessed on 04 January 2013] Investopedia, (2013b).Capital Asset Pricing Model – CAPM [Online] Available at http://www.investopedia.com//c/capm.asp#axzz2H49nREtB [Accessed on 04 January, 2013] Maclaney, E and Atrill, P. 2002.ing: An Introduction. 2nded. London:Prentice Hall. McCarthy, D., Porteous,A (2011). What lies beneath.[Analyst Report] Thomson One Banker Collection.Evolution Securities (London) Birmingham Library. Penman, Stephen.H.,2010. Financial Statement Analysis and Security Valuation. 4thed. New York: Mc Graw Hill Sainsbury’s, (2012) . Available at http://www.j-sainsbury.co.uk/about-us/ [Accessed on 18th November, 2012] Sainsbury’s (2012) Annual Report 2008-2012. London: J Sainsbury’s Scarborough, J et al (2011). Good 3Q sales - as expected. [Analyst Report] Thomson One banker Collection. RBS (London), Birmingham Library. Taylor P. (2012) IT makeover delivers strategic advantage. [Online] Available at http://www.ft.com/cms/s/0/ba0441f4-83ea-11e1-9d54-00144feab49a.html#axzz2I5IQgqMv [Accessed 14th December, 2012] Tesco, (2012).Annual Report 2008-2012. Hertfordshire: Tesco
Telegraph (2012). Sainsbury's customers turning to convenience stores and online. [Online] Available Athttp://www.telegraph.co.uk/finance/newsbysector/retailandconsumer/9678814/Sainsbur ys-customers-turning-to-convenience-stores-and-online.html [Accessed on 24 November, 2012). Thomson One Banker (2013). [e-library]. Available through University of Birmingham Library Website: http://banker.thomsonib.com.ezproxyd.bham.ac.uk/ta/?ExpressCode=Birmingham Vázquez, J., 2011. Solid 3Q10 Sales.[ Analyst Report] Thomson One banker Collection. London Birmingham Library
Related Documents 171j1w
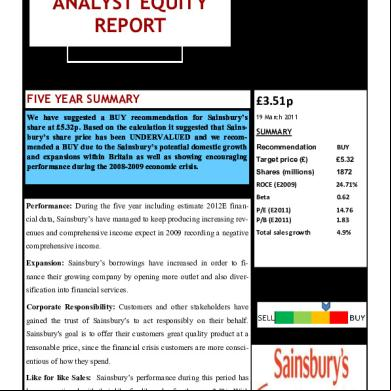
Sainsbury Report Final_merged 4p2k54
November 2022 0
Sainsbury Financial Analysis 3h474l
October 2019 12
October 2019 64

Analyzing Capital Structure Of Tesco And Sainsbury 56551z
December 2019 149
Report 302o3s
December 2019 80
Report 302o3s
March 2023 0More Documents from "Tosin Yusuf" 2r2r4p
Sainsbury Report Final_merged 4p2k54
November 2022 0
Coejuanita.pdf The Jack Coe I Know.pdf 3mb
December 2019 282
Ancient Well Compedium Of Miracles 6s2d5x
December 2021 0
Gaya Gerak Listrik Dan Peristiwa Oksidasi-reduksi 226w28
May 2020 15
3 - Modal Verbs 33104q
August 2022 0