International Financial Management Ppt Mba 3x432r
This document was ed by and they confirmed that they have the permission to share it. If you are author or own the copyright of this book, please report to us by using this report form. Report r6l17
Overview 4q3b3c
& View International Financial Management Ppt Mba as PDF for free.
More details 26j3b
- Words: 3,078
- Pages: 39
1
INTERNATIONAL FINANCIAL MANAGEMENT
BABASAB PATIL
Course Overview 2
Foreign Exchange Markets
Sourcing Capital in Global Markets
International Financial Management
Synthesis
Managing FOREX Exposure
Foreign Investment Decisions
Course Overview 3
Introduction to international finance
Introduction and course overview The foreign exchange market Corporate governance Parity conditions in international finance Foreign exchange derivative contracts
International corporate finance issues
Transactions exposure to exchange rates Translation exposure to exchange rates Operating exposure to exchange rates
Course Overview 4
International investment analysis
Cost of capital International bond markets International equity markets Capital structure
Corporate strategy and foreign investment analysis
Offshoring/Outsourcing Project Finance Cross-border t Ventures Cross-border Mergers
Course Overview 5
Global Financial Crisis Bailouts
and Bans Can a country go bankrupt?
What is special about international finance? 6
Foreign exchange risk
Political risk
E.g., an unexpected overturn of the government that jeopardizes existing negotiated contracts…
Market imperfections
E.g., an unexpected devaluation adversely affects your export market…
E.g., trade barriers and tax incentives may affect location of production…
Expanded opportunity sets
E.g., raise funds in global markets, gains from economies of scale…
What is money? 7
Barter economy Search
frictions Indivisibilities Transferability
Commodity money Beaver
pelts Dried corn Metals
Fiat money Faith
in government…
8
9
The Monetary System 10
Bimetallism: Before 1875 Free coinage was maintained for both gold and silver Gresham’s Law: Only the abundant metal was used as money, diving more scarce metals out of circulation Classic gold standard: 1875-1914 Great Britain introduced full-fledged gold standard in 1821, (effectively) in the 1850s, in 1875, the US in 1879, Russia and Japan in 1897. Gold alone is assured of unrestricted coinage There is a two-way convertibility between gold and national currencies at a stable ratio Gold may be freely exported and imported Cross-border flow of gold will help correct misalignment of exchange rates and will also regulate balance of payments. The gold standard provided a 40 year period of unprecedented stability of exchange rates which served to promote international trade.
The Monetary System 11
Interwar period: 1915-1944 World War I ended the classical gold standard in 1914 Trade in gold broke down After the war, many countries suffered hyper inflation Countries started to ―cheat‖ (sterilization of gold) Predatory devaluations (recovery through exports!) The US, Great Britain, Switzerland, and the Scandinavian countries restored the gold standard in the 1920s. After the great depression, and ensuing banking crises, most countries abandoned the gold standard. Bretton Woods system: 1945-1972 U.S. dollar was pegged to gold at $35.00/oz. Other major currencies established par values against the dollar. Deviations of ±1% were allowed, and devaluations could be negotiated.
12
13
14
Guess what happened to inflation?
The Monetary System 15 Broad Real US dollar Index Source: www.federalreserve.gov
130
120
March 73 =100
110
100
90
80
70
The Monetary System 16
Jamaica Agreement (1976) Central banks were allowed to intervene in the foreign exchange markets to iron out unwarranted volatilities. Gold was officially abandoned as an international reserve asset. Half of the IMF’s gold holdings were returned to the and the other half were sold, with proceeds used to help poor nations. Non-oil exporting countries and less-developed countries were given greater access to IMF funds. Plaza Accord (1985) G-5 countries (, Japan, , the U.K., and the U.S.) agreed that it would be desirable for the U.S. dollar to depreciate. Louvre Accord (1987) G-7 countries (Canada and Italy were added) would cooperate to achieve greater exchange rate stability. G-7 countries agreed to more closely consult and coordinate their macroeconomic policies.
The Monetary System 17 Broad Real US dollar Index Source: www.federalreserve.gov
130
Plaza 1985 120
???? March 73 =100
110
Jamaica 1978 100
90
80
70
Louvre 1987
Current Exchange Rate Arrangements
18
36 major currencies, such as the U.S. dollar, the Japanese yen, the Euro, and the British pound are determined largely by market forces. 50 countries, including the China, India, Russia, and Singapore, adopt some forms of ―Managed Floating‖ system. 41 countries do not have their own national currencies! 40 countries, including many islands in the Caribbean, many African nations, UAE and Venezuela, do have their own currencies, but they maintain a peg to another currency such as the U.S. dollar. The remaining countries have some mixture of fixed and floating exchange-rate regimes. Note: As of July 31, 2005.
The Euro 19
Product of the desire to create a more integrated European economy. Eleven European countries adopted the Euro on January 1, 1999:
The following countries opted out initially:
Austria, Belgium, Finland, , , Ireland, Italy, Luxembourg, Netherlands, Portugal, and Spain. Denmark, Greece, Sweden, and the U.K.
Euro notes and coins were introduced in 2002 Greece adopted the Euro in 2001 Slovenia adopted the Euro in 2007
Will the UK (Sweden) the Euro?
20
The Mini-Case can be found in E&R, p. 57.
Please read E&R pp. 35-46 in preparation for the discussion next time.
Think about: Potential benefits and costs of adopting the euro. Economic and political constraints facing the country. The potential impact of British adoption of the euro on the international financial system, including the role of the U.S. dollar. The implications for the value of the euro of expanding the EU to include, e.g., Eastern European countries.
The Foreign Exchange Market 21
The FX market encomes:
No central market place
Conversion of purchasing power from one currency to another; bank deposits of foreign currency; credit denominated in foreign currency; foreign trade financing; trading in foreign currency options & futures, and currency swaps World-wide linkage of bank currency traders, non-bank dealers (IBanks, insurance companies, etc.), and FX brokers—like an international OTC market
Largest financial market in the world
Daily trading is estimated to be US$3.21 trillion Trading occurs 24 hours a day London is the largest FX trading center
Global Foreign Exchange Market Turnover 22
Source: BIS Triennial Central Bank Survey of Foreign Exchange and Derivatives Market Activity in April 2007.
BIS Triennial Survey… 23
The Foreign Exchange Market 24
The FX market is a two-tiered market: Interbank
Market (Wholesale)
s
for about 83% of FX trading volume—mostly speculative or arbitrage transactions About 100-200 international banks worldwide stand ready to make a market in foreign exchange FX brokers match buy and sell orders but do not carry inventory and FX specialists Client
Market (Retail)
s
for about 17% of FX trading volume Market participants include international banks, their customers, non-bank dealers, FX brokers, and central banks Note: Data is from 2007.
Central Banking 25
The U.S. monetary authorities occasionally intervene in the foreign exchange (FX) market to counter disorderly market conditions. The Treasury, in consultation with the Federal Reserve System, has responsibility for setting U.S. exchange rate policy, while the Federal Reserve Bank New York is responsible for executing FX intervention. U.S. FX intervention has become less frequent in recent years. http://www.ny.frb.org/
WEDNESDAY, NOVEMBER 8, 2000
U.S. INTERVENES IN THIRD QUARTER TO BUY 1.5 BILLION EUROS NEW YORK FED REPORTS
NEW YORK – The U.S. monetary authorities intervened in the foreign exchange markets on one occasion during the third quarter, on September 22nd, buying a total of 1.5 billion euros, the Federal Reserve Bank of New York said today in its quarterly report to the U.S. Congress.
According to the report, the dollar appreciated 8.2 percent against the euro and appreciated 2 percent against the Japanese yen during the three month period that ended September 30, 2000.
The intervention was carried out by the foreign exchange trading desk at the New York Fed, operating in coordination with the European Central Bank (ECB) and the monetary authorities of Japan, Canada, and the United Kingdom. The amount was split evenly between the Federal Reserve System and the U.S. Treasury Department’s Exchange Stabilization Fund (ESF).
The report was presented by Peter R. Fisher, executive vice president of the New York Fed and the Federal Open Market Committee’s (FOMC) manager for the system open market , on behalf of the Treasury and the Federal Reserve System.
The Foreign Exchange Market 26
The Spot Market 27
The spot market involves the immediate purchase or sale of foreign exchange
Cash settlement occurs 1-2 days after the transaction
Currencies are quoted against the US dollar Interbank FX traders buy currency for their inventory at the bid price Interbank FX traders sell currency for their inventory at the ask price Bid price is less than the ask price Bid-ask spread is a transaction cost
The Spot Market – Direct Quotes
28
US dollar price of 1 unit of foreign currency—$ are in the numerator (foreign currency is priced in of dollars) $/€ = 1.5000 (1€ costs $1.5000) $/£ = 2.0000 (1£ costs $2.0000)
Currency changes Suppose that today, $/€ = 1.5000 and in 1 month, $/€ = 1.5050
The $ has depreciated in value Alternatively, the € has appreciated in value
Suppose that today, $/£ = 2.0000 and in 1 month, $/£ = 1.9950
The $ has appreciated in value Alternatively, the £ has depreciated in value
The Spot Market – Indirect Quotes
29
Foreign currency price of $1—$ are in the denominator (US dollar is priced in of foreign currency) €/$ = 0.6667 ($1costs €0.6667) £/$ = 0.5000 ($1 costs £0.5000)
Currency changes Suppose that today, €/$ = 0.6667 and in 1 month, €/$ = 0.6600
The $ has depreciated in value Alternatively, the € has appreciated in value
Suppose that today, £/$ = 0.5000 and in 1 week, £/$ = 0.5050.
The $ has appreciated in value Alternatively, the £ has depreciated in value
The Spot Market - Conventions 30
Denote the spot rate as S
For most currencies, use 4 decimal places in calculations
If we are talking about the US, always quote spot rates as the dollar price of the foreign currency i.e. as direct quotes, S($/€), S($/C$), S($/£), etc Increase in the exchange rate the US dollar is depreciating
With exceptions: i.e. S(¥/$)=109.0750, but S($/¥)=0.009168
Costs more to buy 1 unit of foreign currency
Decrease in the exchange rate the US dollar is appreciating
Costs less to buy 1 unit of foreign currency
The Spot Market 31 Currency U.S. $ equiv. per U.S. $ Country Wed. Tues. Wed. Tues. Japan (Yen) .008639 .008681 115.75 115.20 30-Day Forward .008676 .008718 115.26 114.71 T he New York foreign exc hange s elling rates below apply to .008750 .008791 114.28 113.76 trading among banks in amounts of $1 million and more , as quoted 90-Day Forward Forward .008865 .008907 112.80 112.28 at 4 p.m. Eas tern time by Dow J ones T elerate Inc . and other s ourc es180-Day . Jordan (Dinar) 1.4075 1.4075 .7105 .7105 Retail trans ac tions provide fewer units of foreign c urrenc y per Kuwait (Dinar) 3.3367 3.3389 .2997 .2995 dollar. Lebanon (Pound) .0006445 .0006445 1551.50 1551.50 Currency Malaysia (Ringgit) .4018 .4002 2.4885 2.4990 per U.S. $ U.S. $ equiv. Malta (Lira) 2.7624 2.7701 .3620 .3610 Country Wed. Tues. Wed. Tues. Mexico (Peso) .... .... .... .... Argentina (Peso) 1.0012 1.0012 .9988 .9988 Floating rate .1278 .1277 7.8220 7.8330 Australia (Dollar) .7805 .7902 1.2812 1.2655 Netherland (Guilder) .5655 .5699 1.7685 1.7547 Austria (Schilling) .09043 .09101 11.058 10.988 New Zealand (Dollar) .7072 .7106 1.4140 1.4073 Bahrain (Dinar) 2.6525 2.6525 .3770 .3770 Norway (Krone) .1540 .1548 6.4926 6.4599 Belgium (Franc) .03080 .03105 32.470 32.205 Pakistan (Rupee) .02529 .02529 39.540 39.540 Brazil (Real) .9607 .9615 1.0409 1.0401 Peru (new Sol) .3814 .3840 2.6218 2.6039 Britain (Pound) 1.6880 1.6946 .5924 .5901 Philippines (Peso) .03800 .03802 26.318 26.300 30-Day Forward 1.6869 1.6935 .5928 .5905 Poland (Zloty) .3460 .3475 2.8900 2.8780 90-Day Forward 1.6843 1.6910 .5937 .5914 Portugal (Escudo) .006307 .006369 158.55 157.02 180-Day Forward 1.6802 1.6867 .5952 .5929 Russia (Ruble) (a) .0001787 .0001788 5595.00 5594.00 Canada (Dollar) .7399 .7370 1.3516 1.3568 Saudi Arabia (Riyal) .2666 .2667 3.7503 3.7502 30-Day Forward .7414 .7386 1.3488 1.3539 Singapore (Dollar) .7116 .7124 1.4053 1.4037 90-Day Forward .7442 .7413 1.3437 1.3489 Slovak Rep. (Koruna) .03259 .03259 30.688 30.688 180-Day Forward .7479 .7450 1.3370 1.3422 South Africa (Rand) .2141 .2142 4.6705 4.6690 Chile (Peso) .002352 .002356 425.25 424.40 South Korea (Won) .001184 .001184 844.75 844.65 China (Renminbi) .1201 .1201 8.3272 8.3276 Spain (Peseta) .007546 .007603 132.52 131.53 Colombia (Peso) .0009985 .0009985 1001.50 1001.50 Sweden (Krona) .1431 .1435 6.9865 6.9697 Czech. Rep (Krouna) .... .... .... .... Switzerland (Franc) .7334 .7387 1.3635 1.3537 Commercial rate .03662 .03677 27.307 27.194 30-Day Forward .7357 .7411 1.3593 1.3494 Denmark (Krone) .1663 .1677 6.0118 5.9633 90-Day Forward .7401 .7454 1.3511 1.3416 Ecuador (Sucre) .... .... .... .... 180-Day Forward .7470 .7523 1.3386 1.3293 Floating rate .0002766 .0002787 3615.00 3587.50 Taiwan (Dollar) .03638 .03637 27.489 27.493 Finland (Markka) .2121 .2135 4.7150 4.6841 Thailand (Baht) .03902 .03906 25.625 25.605 (Franc) .1879 .1893 5.3220 5.2838 Turkey (Lira) .00000911 .00000915 109755.00 109235.00 30-Day Forward .1882 .1896 5.3126 5.2741 United Arab (Dirham) .2723 .2723 3.6720 3.6720 90-Day Forward .1889 .1903 5.2935 5.2558 Uruguay (New Peso) .... .... .... .... 180-Day Forward .1901 .1914 5.2617 5.2243 Financial .1145 .1145 8.7300 8.7300 (Mark) .6352 .6394 1.5744 1.5639 Venezuela (Bolivar) .002098 .002096 476.70 477.12 30-Day Forward .6364 .6407 1.5714 1.5607 --90-Day Forward .6389 .6432 1.5652 1.5547 SDR 1.4315 1.4326 .6986 .6980 180-Day Forward .6430 .6472 1.5552 1.5450 ECU 1.2308 1.2404 .......... ........... Greece (Drachma) .004049 .004068 246.98 245.80 Hong Kong (Dollar) .1292 .1292 7.7390 7.7390 Special Drawing Rights (SDR) are based on exchange rates for Hungary (Forint) .006139 .006164 162.89 162.23 the U.S., German, British, French, and Japanese currencies. Source: India (Rupee) .02787 .02786 35.875 35.890 International Monetary Fund. Indonesia (Rupiah) .0004233 .0004233 2362.15 2362.63 European Currency Unit (ECU) is based on a basket of community Ireland (Punt) 1.6664 1.6714 .6001 .5983 currencies. Israel (Shekel) .3079 .3085 3.2474 3.2412 a-fixing, Moscow Interbank Currency Exchange. Italy (Lira) .0006483 .0006510 1542.50 1536.00
W ednes day, J anuary 8, 1997
EXCHANGE RAT ES
US dollar price: S($/£)=1.6880 £1 costs $1.6880 UK pound price: S(£/$)=0.5924 $1 costs £0.5924
And note that 1 S ($ / £) S (£/$)
The Spot Market 32
• The current exchange, S($/€)=1.5000. In 1 month, it is S(€/$)=0.6689 – Has the US dollar appreciated or depreciated? – By what % has the exchange rate changed?
• Convert S(€/$)=0.6689 to: 1/S(€/$)=S($/€)=1.4950. – Now we see that the exchange rate has decreased US dollar has appreciated. – The % change per month is:
1.4950- 1.5000 0.33% 1.5000
Cross Exchange Rates 33
• The exchange rate between 2 currencies where neither currency is the US dollar • We know the dollar rates. What if we want to know other rates, i.e. S(€/£) ? – Calculate cross-rates from dollar rates – S($/€)=1.5000 and S($/£)=2.0000. What is S(€/£), i.e. the € price of £?
$ 1 1.3333 2.0000 £ $ £ 1.5000 £1 S ( / £) 1.3333
Cross-Exchange Rates 34
• Cross-rates must be internally consistent; otherwise arbitrage profit opportunities exist. • Suppose that: $ £ $ £ • A profit opportunity exists. Either S(€/£) is too high or S(€/$) or S($/£) is too low. • How does this work? • Sell high and buy low.
Cross-Exchange Rates Example
35
Bank1: S($/¥)=0.0084; Bank2: S($/€)=1.0500; Bank3: S(€/¥)=0.0081. The implied cross rate between Bank 1 and 2 is: S(€/¥)=0.0080. You have ¥1,250,000. What should you do?
Go to Bank 3. Convert ¥1,250,000 to €10,125.00 @ 0.0081 Go to Bank 2. Convert €10,125 to $10,631.25 @ 1.0500. Go to Bank 1. Convert $10,631.25 to ¥1,265,625.00 @ (1/0.0084)
Sell ¥ high!
Buy ¥ low!
The initial ¥1,250,000 becomes ¥1,265,625. You earn a risk-free profit of ¥15,625, or 1.25%.
The Forward Market 36
Forward market involves contracting today for the future purchase or sale of foreign exchange Forward prices are quoted the same way as spot prices Denote the forward price maturing in N days as FN i.e.
F30($/£), F180($/€), F90(€/ ¥), etc
The forward dollar price of the euro can be: Same
as the spot price Higher than the spot price (euro at a ) Lower than the spot price (euro at a discount)
Wrap-Up 37
The foreign exchange market is by far the largest financial market in the world. Currency traders trade currencies for spot and forward delivery. Exchange rates are by convention quoted against the U.S. dollar, but cross-rates can easily be calculated from bilateral rates. Triangular arbitrage forces the cross-rates to be internally consistent. The euro has enhanced trade within Europe, and the currency has the potential of becoming a major world currency.
Assignment 38
Suppose you are Professor Paul Krugman (Princeton University Economics Professor and NYT columnist (Op-Ed Page)). On October 13, 2008, at 5am you receive a phone call from the Royal Swedish Academy informing you that you have been awarded the Sveriges Riksbank Prize in Economic Sciences in Memory of Alfred Nobel for your work on international trade and economic geography. After first thinking this is a practical joke – ―that is surely a fake Swedish accent‖ - the news sink in and you realize you have a small problem. The prize will be awarded at a ceremony on December 10th in Stockholm, at which time you will receive the a medal, a diploma, and a prize check for SEK 10,000,000 or US$ 1,394,136 at the current spot rate (SEK 7.1729US$). What should you do?
Nobel Prize Problem… 39
SEK/USD
Nobel Prize in US$
9
1800000
8.5
1700000
8
1600000
7.5
1500000
7
1400000
6.5
1300000
6
1200000
5.5
1100000
5
1000000
Related Documents 171j1w

International Financial Management Ppt Mba 3x432r
November 2019 73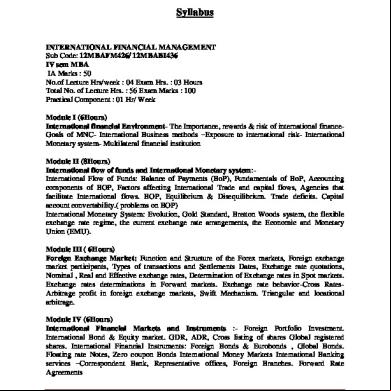
Mba Iv International Financial Management [12mbafm426] Notes 554f3n
November 2019 462
Mba Iv International Financial Management [12mbafm426] Notes 554f3n
December 2019 52
International Financial Management Notes.pdf 4v1u4g
November 2019 152
International Financial Management r4d1a
December 2020 0