Finance Simulation_ Capital Budgeting bp1d
This document was ed by and they confirmed that they have the permission to share it. If you are author or own the copyright of this book, please report to us by using this report form. Report r6l17
Overview 4q3b3c
& View Finance Simulation_ Capital Budgeting as PDF for free.
More details 26j3b
- Words: 502
- Pages: 1
11/19/2017
Finance Simulation: Capital Budgeting
Finance Simulation: Capital Budgeting prepare dashboard
analyze
I/S and B/S
cashflow statement
decide
financial analysis
project details
historical financials
project updates
Select Projects
Risk
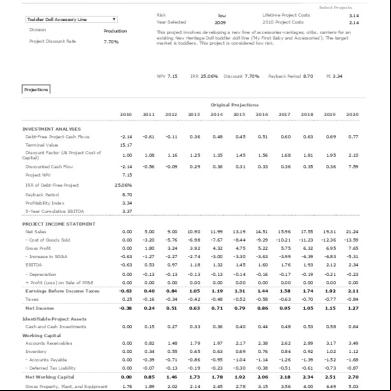
Toddler Doll Accessory Line
low
Year Selected
Division
Production
Project Discount Rate
7.70%
2009
Lifetime Project Costs
3.14
2010 Project Costs
2.14
This project involves developing a new line of accessories-carriages, cribs, carriers-for an existing New Heritage Doll toddler doll line ('My First Baby and Accessories'). The target market is toddlers. This project is considered low risk.
NPV 7.15
IRR 25.06%
Discount 7.70%
Payback Period 8.70
PI 3.34
Projections Original Projections 2010
2011
2012
2013
2014
2015
2016
2017
2018
2019
2020
Debt-Free Project Cash Flows
-2.14
-0.61
-0.11
0.36
0.48
0.45
0.51
0.60
0.63
0.69
0.77
Terminal Value
15.17 1.00
1.08
1.16
1.25
1.35
1.45
1.56
1.68
1.81
1.95
2.10
-2.14
-0.56
-0.09
0.29
0.36
0.31
0.33
0.36
0.35
0.36
7.59
INVESTMENT ANALYSES
Discount Factor (At Project Cost of Capital) Discounted Cash Flow Project NPV
7.15
IRR of Debt-Free Project
25.06%
Payback Period
8.70
Profitability Index
3.34
5-Year Cumulative EBITDA
3.37
PROJECT INCOME STATEMENT Net Sales
0.00
5.00
9.00
10.90
11.99
13.19
14.51
15.96
17.55
19.31
21.24
- Cost of Goods Sold
0.00
-3.20
-5.76
-6.98
-7.67
-8.44
-9.29
-10.21
-11.23
-12.36
-13.59
Gross Profit
0.00
1.80
3.24
3.92
4.32
4.75
5.22
5.75
6.32
6.95
7.65
- Increase in SG&A
-0.63
-1.27
-2.27
-2.74
-3.00
-3.30
-3.63
-3.99
-4.39
-4.83
-5.31
EBITDA
-0.63
0.53
0.97
1.18
1.32
1.45
1.60
1.76
1.93
2.12
2.34
- Depreciation
0.00
-0.13
-0.13
-0.13
-0.13
-0.14
-0.16
-0.17
-0.19
-0.21
-0.23
+ Profit (Loss) on Sale of PP&E
0.00
0.00
0.00
0.00
0.00
0.00
0.00
0.00
0.00
0.00
0.00
Earnings Before Income Taxes
-0.63
0.40
0.84
1.05
1.19
1.31
1.44
1.58
1.74
1.92
2.11
0.25
-0.16
-0.34
-0.42
-0.48
-0.52
-0.58
-0.63
-0.70
-0.77
-0.84
-0.38
0.24
0.51
0.63
0.71
0.79
0.86
0.95
1.05
1.15
1.27
0.00
0.15
0.27
0.33
0.36
0.40
0.44
0.48
0.53
0.58
0.64
s Receivables
0.00
0.82
1.48
1.79
1.97
2.17
2.38
2.62
2.89
3.17
3.49
Inventory
0.00
0.34
0.55
0.65
0.63
0.69
0.76
0.84
0.92
1.02
1.12
- s Payable
0.00
-0.39
-0.71
-0.86
-0.95
-1.04
-1.14
-1.26
-1.39
-1.52
-1.68
- Deferred Tax Liability
0.00
-0.07
-0.13
-0.19
-0.23
-0.30
-0.38
-0.51
-0.61
-0.73
-0.87
Net Working Capital
0.00
0.85
1.46
1.73
1.78
1.92
2.06
2.18
2.34
2.51
2.70
Gross Property, Plant, and Equipment
1.76
1.89
2.02
2.14
2.45
2.78
3.15
3.56
4.00
4.49
5.03
- Accumulated Depreciation
0.00
-0.13
-0.26
-0.38
-0.51
-0.65
-0.81
-0.98
-1.17
-1.37
-1.60
Net Property, Plant, and Equipment
1.76
1.76
1.76
1.76
1.94
2.13
2.34
2.58
2.83
3.12
3.43
Total Net Assets
1.76
2.61
3.22
3.49
3.72
4.05
4.40
4.75
5.17
5.63
6.13
Taxes Net Income Identifiable Project Assets Cash and Cash Investments Working Capital
run archive
us
credits
http://forio.com/simulation/harvard-capital/#page=project_details
© 2010 Harvard Business School Publishing. Harvard Business Publishing is an of Harvard Business School. Developed in Partnership with Forio Business Simulations.
1/1
Finance Simulation: Capital Budgeting
Finance Simulation: Capital Budgeting prepare dashboard
analyze
I/S and B/S
cashflow statement
decide
financial analysis
project details
historical financials
project updates
Select Projects
Risk
Toddler Doll Accessory Line
low
Year Selected
Division
Production
Project Discount Rate
7.70%
2009
Lifetime Project Costs
3.14
2010 Project Costs
2.14
This project involves developing a new line of accessories-carriages, cribs, carriers-for an existing New Heritage Doll toddler doll line ('My First Baby and Accessories'). The target market is toddlers. This project is considered low risk.
NPV 7.15
IRR 25.06%
Discount 7.70%
Payback Period 8.70
PI 3.34
Projections Original Projections 2010
2011
2012
2013
2014
2015
2016
2017
2018
2019
2020
Debt-Free Project Cash Flows
-2.14
-0.61
-0.11
0.36
0.48
0.45
0.51
0.60
0.63
0.69
0.77
Terminal Value
15.17 1.00
1.08
1.16
1.25
1.35
1.45
1.56
1.68
1.81
1.95
2.10
-2.14
-0.56
-0.09
0.29
0.36
0.31
0.33
0.36
0.35
0.36
7.59
INVESTMENT ANALYSES
Discount Factor (At Project Cost of Capital) Discounted Cash Flow Project NPV
7.15
IRR of Debt-Free Project
25.06%
Payback Period
8.70
Profitability Index
3.34
5-Year Cumulative EBITDA
3.37
PROJECT INCOME STATEMENT Net Sales
0.00
5.00
9.00
10.90
11.99
13.19
14.51
15.96
17.55
19.31
21.24
- Cost of Goods Sold
0.00
-3.20
-5.76
-6.98
-7.67
-8.44
-9.29
-10.21
-11.23
-12.36
-13.59
Gross Profit
0.00
1.80
3.24
3.92
4.32
4.75
5.22
5.75
6.32
6.95
7.65
- Increase in SG&A
-0.63
-1.27
-2.27
-2.74
-3.00
-3.30
-3.63
-3.99
-4.39
-4.83
-5.31
EBITDA
-0.63
0.53
0.97
1.18
1.32
1.45
1.60
1.76
1.93
2.12
2.34
- Depreciation
0.00
-0.13
-0.13
-0.13
-0.13
-0.14
-0.16
-0.17
-0.19
-0.21
-0.23
+ Profit (Loss) on Sale of PP&E
0.00
0.00
0.00
0.00
0.00
0.00
0.00
0.00
0.00
0.00
0.00
Earnings Before Income Taxes
-0.63
0.40
0.84
1.05
1.19
1.31
1.44
1.58
1.74
1.92
2.11
0.25
-0.16
-0.34
-0.42
-0.48
-0.52
-0.58
-0.63
-0.70
-0.77
-0.84
-0.38
0.24
0.51
0.63
0.71
0.79
0.86
0.95
1.05
1.15
1.27
0.00
0.15
0.27
0.33
0.36
0.40
0.44
0.48
0.53
0.58
0.64
s Receivables
0.00
0.82
1.48
1.79
1.97
2.17
2.38
2.62
2.89
3.17
3.49
Inventory
0.00
0.34
0.55
0.65
0.63
0.69
0.76
0.84
0.92
1.02
1.12
- s Payable
0.00
-0.39
-0.71
-0.86
-0.95
-1.04
-1.14
-1.26
-1.39
-1.52
-1.68
- Deferred Tax Liability
0.00
-0.07
-0.13
-0.19
-0.23
-0.30
-0.38
-0.51
-0.61
-0.73
-0.87
Net Working Capital
0.00
0.85
1.46
1.73
1.78
1.92
2.06
2.18
2.34
2.51
2.70
Gross Property, Plant, and Equipment
1.76
1.89
2.02
2.14
2.45
2.78
3.15
3.56
4.00
4.49
5.03
- Accumulated Depreciation
0.00
-0.13
-0.26
-0.38
-0.51
-0.65
-0.81
-0.98
-1.17
-1.37
-1.60
Net Property, Plant, and Equipment
1.76
1.76
1.76
1.76
1.94
2.13
2.34
2.58
2.83
3.12
3.43
Total Net Assets
1.76
2.61
3.22
3.49
3.72
4.05
4.40
4.75
5.17
5.63
6.13
Taxes Net Income Identifiable Project Assets Cash and Cash Investments Working Capital
run archive
us
credits
http://forio.com/simulation/harvard-capital/#page=project_details
© 2010 Harvard Business School Publishing. Harvard Business Publishing is an of Harvard Business School. Developed in Partnership with Forio Business Simulations.
1/1
Related Documents 171j1w
Finance Simulation_ Capital Budgeting bp1d
December 2019 50
Capital Budgeting 4l1t61
August 2021 0
Capital Budgeting 4l1t61
April 2020 86
Capital Budgeting 4l1t61
November 2019 68
Inflation And Capital Budgeting 1yu6n
April 2022 0
Capital Budgeting Assignment 611e4z
January 2022 0More Documents from "Karthi Keyan" 4e221a

Qrg-dc-004 Procedure And Regulation Governing The Requirements For w 3v541
January 2022 0
C5 el73
December 2021 0
Aircraft General Engineering And Maintenance Practices 6xu2
October 2021 0
Feed Check Valve 1u4ia
November 2019 46
Astm C12 2d2869
November 2019 67