Er Pv Isotherm k1n5t
This document was ed by and they confirmed that they have the permission to share it. If you are author or own the copyright of this book, please report to us by using this report form. Report r6l17
Overview 4q3b3c
& View Er Pv Isotherm as PDF for free.
More details 26j3b
- Words: 1,921
- Pages: 6
1
Theoretical Pressure-Volume Isotherms Based on Different Equations of State Banda, Marybeth Hope T. Abstract: Real gases only obey the Ideal Gas Law at low pressures and at high temperatures. As a result, modifications of the Ideal Gas Law were developed and these are called Equations of State. This experiment aims to describe the isotherms of different equations of state for Neon; differentiate them from each other at the critical temperature; and to differentiate the equations of state from the ideal gas equation at the critical temperature. Results show that different equations of state have different forms of their corresponding isotherms and may be accurate only at a specific volume, pressure, or temperature range. Different equations of state may or may not be accurate near or at the critical temperature. Further, different equations of state show considerable deviations from ideality to describe effectively the real behaviour of a gas, in this case, of neon. Introduction A system is said to be at equilibrium when its properties is independent of time and there is no heat flowing through the system. The state of the system is then defined entirely by state variables. Examples of these variables are volume, temperature, and pressure. When a sufficient number of state variables are specified, all of the other properties of the system are fixed (1). When the amount of the pure substance is held constant, one of these variables can be calculated when the other two is known. The simplest equation that defines the unknown variable as a function of the known variables is the ideal gas law. However, real gases only obey this equation at low pressures and at high temperatures. Consequently, other “equations of state”—as they are called— have been developed to for these variations. The ideal gas law is derived from Boyles’ Law, Charles Law, Amonton’s Law, and Avogadro’s Law. Boyle’s Law states that pressure is inversely proportional to volume at constant temperature and amount of gas:
P∝
1 V
P=
k V
Charles’ Law states that volume is directly proportional to temperature at fixed pressure and amount of gas:
V ∝T
V =kT
Avogadro’s law states that volume is directly proportional to the amount of gas at constant temperature and pressure:
V ∝n
V =kn Combining these four laws gives:
PV =nkT PV =nRT Where R is the universal gas constant. Experimental results show deviations of the behaviour of gases from this equation. It was observed that real gases only obey the ideal gas equation at high temperatures and at low pressures. At high temperatures, the gas molecules overcome the intermolecular forces of attraction due to the relatively high kinetic
2 energy possessed by the molecules. At low pressures, the gas molecules are less hindered and are able to spread further and thereby overcoming the forces of interaction between molecules. In 1873, a correction to the ideal gas law was introduced to for the volume and intermolecular forces between molecules (2). This correction is referred to as the van der Waals equation:
(
p+
an2 ( V −nb )=nRT V2
)
Where a and b are van der Waals constants for a particular gas. The constant a represents the correction due to pressure and is affected by the interactions between gas molecules. The constant b represents the correction due to volume and b is affected by the size of the gas molecules. The van der Waals equation predicts the behaviour of a real gas based on physical phenomena. An equation of Clapeyron-Clausius Berthelot Equation:
(
p+
state derived from Equation (3) is the
8 p 2c V 3c ( V m −b ) =RT R
)
Another equation of state is the RedlichKwong Equation. It is a two-parameter equation and is more accurate than the van der Waals equation of state (4):
P=
RT a − V m−b √T V m ( V m+ b )
Another equation of state considered in this experiment is the equation of state developed by Peng and Robinson. It was found to be useful for liquids and gases:
P=
RT a − V m−b V m ( V m+ b ) +b (V m−b)
The deviation of a gas from ideality can be expressed by the compressibility factor, Z:
Z=
PVm RT
Where P is the pressure of the system, Vm is the molar volume, R is the universal gas constant, and T is the temperature of the system. When the Z of a gas at a given pressure, temperature, and volume, is equal to one, the gas behaves ideally. When Z is greater than one, the non-ideal behaviour of the gas is due to repulsive forces. When Z is lesser than one, the non-ideal behaviour is due to the attraction between molecules. The critical volume, temperature, and pressure of neon is 0.0390927L/mol, 44.40K, and 27.56 bar, respectively. The objectives of this experiment are to describe the isotherms of different equations of state for Neon; differentiate them from each other at the critical temperature; and to differentiate the equations of state from the ideal gas equation at the critical temperature. Experimental Methods This experiment focuses on the plotting of the isotherms of neon based on different equations of state and is made possible with the use of a personal computer that is installed with Microsoft Excel. The critical constants of methane and neon were looked up in literature. From these values, the different coefficients required by the different equations of state were calculated. These coefficients, along with the critical constants, were used to calculate the pressure of methane at different molar volumes around the critical volume and at different temperatures around the critical temperature. These calculated values of pressure were then plotted against molar volume. Results and Discussion
3 The objectives of this experiment are to describe the isotherms of different equations of state; differentiate them from each other at the critical temperature; and to differentiate the equations of state from the ideal gas equation at the critical temperature. Figure 1 shows the Ideal Gas Equation Isotherms of neon. The pressure was calculated using (E.1). As shown on Figure 1, the pressure decreases as the volume increases. When the volume is further increased, the isotherms converge and are asymptotic with respect to zero pressure.
15.00 150.0
25.00
35.00
Pressure (bar) 100.0 44.40 55.00 50.0
70.00
80.00
90.00
0.0 0.02
220.00 170.00 1.00 120.0015.00 P (bar)
25.00
35.00
44.40
70.00 20.00
0.02 0.04 0.06 0.08 0.10 0.12 0.14 -30.00 55.00 70.00 80.00 90.00 -80.00 -130.00 Volume (L/mol)
Figure 2. van der Waals Isotherm for Neon
200.0 1.00
270.00
0.07
0.12
0.17
Volume (L/mol)
Figure 1. Ideal Gas Isotherm of Neon In the van der Waals isotherm of Neon, however, the pressure of the gas becomes negative as the volume is decreased for systems at 25.00, 15.00, and 1.00 K; while for systems at 35.00K and above, the pressure increases as the volume is decreased. Still, as the volume is increased, the isotherms converge and approach zero pressure.
For the Berthelot Equation of state, the same thing also happens: the pressure is negative for systems at 1.00, 15.00, and 25.00 K. The difference between Berthelot and van der Waals Equation of state is that for systems at 1.00 K, a considerable dip in the value of pressure is observed as the volume is decreased compared with systems at 15.00 K and at 25.00 K. The Berthelot Isotherm values of pressure were calculated using (E.3). 150.0 100.0 1.00
15.00
25.00
35.00
50.0 Pressure (bar) 44.40
The van der Waals Isotherm values for pressure were calculated using (E.2).
0.0 0.00 0.10 0.20 0.30 0.40 0.50 55.00 70.00 80.00 -50.0 -100.0
90.00 -150.0 Volume (L/mol)
Figure 3. Berthelot Equation Isotherm of
4 Neon Almost the same Isotherms are observed for Redlich-Kwong Equation of State as those of the Berthelot Equation of State. The only alteration is that the pressure of a system at 35.00 K now becomes negative as the volume is decreased. A considerable dip in the value of pressure is still observed for the isotherm at 1.00 K. The Redlich-Kwong Isotherm value pressure was calculated using (E.4).
for
300.0
All isotherms of the different equations of state converge and approach zero pressure as the volume is increased. At 44.4 K, the critical temperature of Neon, the Redlich-Kwong and the Peng-Robinson Equation of State has the same isotherm. The Berthelot Isotherm is almost the same as the Ideal Gas Isotherm but with a less steep slope than the Ideal Gas isotherm. The van der Waals Isotherm also has the same linear shape as the Ideal Gas Isotherm but possess a much less steep slope than the Berthelot Isotherm.
200.0 100.0 1.00 15.00 0.0 0.02 Pressure (bar) -100.0
120 25.00 0.07
35.00 0.12
100
44.40 0.17 IGL
-200.0 55.00
70.00 -300.0
Pressure (bar) 80.00
PREoS
M olar Volume (L/mol)
The Peng-Robinson Isotherm of Neon is almost the same as the Redlich-Kwong Isotherms. The only difference is that no considerable dip in the pressure of the isotherm at 1.00 K is observed as the volume is decreased. The Peng-Robinson Isotherm values for pressure were calculated using (E.5). 300.0
Pressure (bar) 44.40
25.00
35.00
0.0 0.03 0.05 0.07 0.09 0.11 55.00 70.00 80.00 -100.0 -200.0
90.00
RKEoS
20 0 0.00000 0.20000 0.40000 0.60000
Figure 4. Redlich-Kwong Equation Isotherm of Neon
200.0 15.00 100.0
BEoS
40
90.00
-400.0
1.00
80 VdW 60
-300.0 Volume (L/mol)
Figure 5. Peng-Robinson Isotherm for Neon
Volume (L/mol)
Figure 6. Different Isotherms at Critical Temperature (44.4 Among the different Equations of State, Peng-Robinson and Redlich-Kwong Equation of State has the greatest deviation from ideality at the critical temperature. The next Equation of State that showed the greatest deviation from ideality is the van der Waals equation of state followed by Berthelot Equation of State.
5
1.1 1.0 0.9 0.8 IGL 0.7
VdW
BEoS
RKEoS
Z 0.6 0.5 0.4 PREoS 0.3 0.2 0.0 0.1 0.1 0.2 0.2 0.3 0.3 0.4 0.4 0.5 0.5
pressure, or temperature range. Different equations of state may or may not be accurate near or at the critical temperature. Different equations of state show considerable deviations from ideality to describe effectively the real behaviour of a gas, in this case, of neon. For future conduct of the experiment, the author recommends that the newer versions of the different equations of state be compared; a wider range of volume be used; the P-V-T graphs for different equations of state be plotted and compared; and that the calculated data be compared with experimental data.
Molar Volume (L/mol) References Figure 7. Deviation from Ideality at the Critical Temperature Conclusion and Recommendations This experiment aimed to describe the isotherms of different equations of state; differentiate them from each other at the critical temperature; and to differentiate the equations of state from the ideal gas equation at the critical temperature. Due to empirical data that showed that real gases only follow the Ideal Gas Law at high temperatures and at low pressures, different equations of state were developed to for these deviations. Different equations of state have different forms of their corresponding isotherms and may be accurate only at a specific volume,
1. Silbey, Robert J., Alberty, Robert A. and Bawendi, Moungi G. Physical Chemistry. 4th. Massachusetts : John Wiley & Sons, Inc., 2005. 2. Ball, David W. Physical Chemistry. Pacific Grove, CA 93950 : Brooks/Cole—Thomson Learning, 2003. 3. Overview Berthelot Equation. [Online] Oxford University Press, 2014. [Cited: January 7, 2015.] http://oxfordindex.oup.com/view/10.1093/oi/authority. 20110803095501662. 4. Young, David. Equations of State. [Online] Cytoclonal Pharmaceutics Inc. [Cited: January 7, 2015.] http://www.ccl.net/cca/documents/dyoung/topicsorig/eq_state.html.
Related Documents 171j1w
Er Pv Isotherm k1n5t
November 2019 36
Adsorption Isotherm 2hd4r
December 2019 46
Gibbs Isotherm Ppt 412q5q
December 2019 20
Type Of Adsorption Isotherm 3g5r64
November 2019 69
Diagram Pv 4x1dw
June 2022 0
Guia-pv 2x2r67
December 2019 45More Documents from "Marybeth Hope" 3f163s
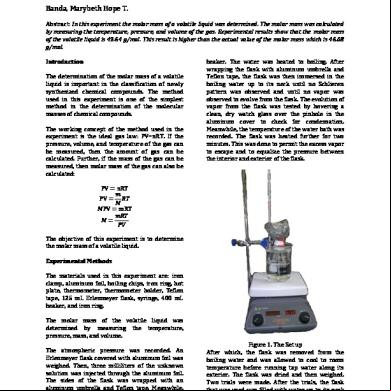
Determination Of The Molar Mass Of A Volatile Liquid 82l27
November 2019 35
Exp 1 Discussion And Conclusion z6w26
November 2019 118
Er Pv Isotherm k1n5t
November 2019 36
2c82t
November 2019 97
Manejo De Combustibles Y Lubricantes 3q1c5b
December 2019 60