Epanet Report 2u5b2j
This document was ed by and they confirmed that they have the permission to share it. If you are author or own the copyright of this book, please report to us by using this report form. Report r6l17
Overview 4q3b3c
& View Epanet Report as PDF for free.
More details 26j3b
- Words: 2,310
- Pages: 18
Contents 1. PROJECT DISCRIPTION ...................................................................................................................... 2 2. INTRODUCTION OF SCHEME ...................................................................................................... 2 2.1 Estimated Area Of Scheme ............................................................................................................. 3 3. RELATED THEORY .............................................................................................................................. 3 3.1 Source Of Water ............................................................................................................................... 3 3.2 Water Consumption ........................................................................................................................ 3 3.3 Factors Effect Water Consumption................................................................................................ 3 3.4: Components Of Water Supply System ....................................................................................... 4 3.5 Methods Of Water Distribution ..................................................................................................... 4 3.6 Pressure In Distribution System .................................................................................................... 4 3.7 Hydraulics Of Water Distribution ................................................................................................. 4 4. DESIGN CRITERIA USED IN PROJECT ............................................................................................ 5 4.1 Design Period ................................................................................................................................... 5 4.2 Population Estimation ..................................................................................................................... 5 4.3 Per Capita Consumption:................................................................................................................ 6 5. CALCULATION .................................................................................................................................... 6 5.1 Design of Pump Head .......................................................................................................................... 6 5.2 Storage Tank ..................................................................................................................................... 7 5.3 Pipe Losses ........................................................................................................................................ 7 5.4 Pump Used........................................................................................................................................ 7 6. RESULTS ................................................................................................................................................. 9 6.1 Attachment of Map .......................................................................................................................... 9 6.2: Map Showing Different Parameters At The Nodes And Links ............................................. 11 6.3: Table For Calculation Of Base Demand .................................................................................... 12 7: RECOMMENDAIONS & SUGGESTION ......................................................................................... 16
Installation of a purification plant at OHT .After some year water to the houses is not
suitable for drinking purpose................................................................................................................. 16
1
DESIGN OF WATER SUPPLY SYSTEM Continued global growth has placed increasing demand upon existing water distribution systems. This growth has fueled the increasing need to analyze existing and design new water distribution systems. EPANET is a computer program that performs extended period model of hydraulic and water quality behave or within pressurized pipe networks. Purpose of this assignment is to design a “Water distribution network “for a housing scheme .A network consists of pipes, nodes (pipe junctions), pumps and storage tanks or reservoirs.
1. PROJECT DISCRIPTION We are provided with a map of Future vision housing society located near the Upper Chenab canal. This report gives a detailed description about how to establish a water distribution system for a scheme. First we have added junctions, pipes, reservoir, OHT and pump. As an input, fill the fields for elevation (251) and demand for nodes, and length, diameter, and roughness (C-factor) for links. For the reservoir we have enter the value of Total Head (212). For the Tank add 271 for the elevation & 50 for its diameter. For the pump, we need to assign it a pump curve (head versus Flow relationship). Enter the ID label 1 in the Pump Curve field. We use the pipe in range of 80-150mm which makes the project economical. As an Output we get pressure value for each node which is in between 14-30m .The output file attached at the end report showing all the data.
2. INTRODUCTION OF SCHEME The scheme under studies has following attributes:
LAND USE No of houses No of apartments No of Flats No of parks Schools Grave yard Dispensary
Total Number 281 3 3 2 1 1 1
2
2.1 Estimated Area Of Scheme Total area of scheme is calculated by using the given scale: 1cm=10m Total area of scheme =19 acre
3. RELATED THEORY 3.1 Source Of Water There are two main source of water 1) Underground 2) Surface. In our case we used underground water source. 3.2 Water Consumption Water consumption means amount of water consumed per day. Or Per capita consumption is the amount of water use by a person per day. Average value is 150-550 lpcd. Water consumption unit vary with its use. 3.3 Factors Effect Water Consumption These are following factors which effect the water consumption: i.
Climate
ii.
Standard of Living
iii.
Quality of water
iv.
Metering
v.
Size of City
vi.
Pressure in system
vii.
Type of Water
viii.
Cost of Water
ix.
Level of Service
3
3.4: Components Of Water Supply System
Collection
Purification
Transmission
Distribuition
3.5 Methods of Water Distribution Purpose of distribution system is to deliver water to consumer with appropriate quality, quantity and pressure. Depending upon the level of source, topography of the area and other conditions water may be forced into distribution system by the following ways: 1. Gravity It is suitable when the source of supply is at sufficient height. 2. Direct Pumping Water is directly pumped into the main distribution network without storage. It is also known as direct pumping. 3. Pumping with storage In this system water is pumped and stored into elevated storage tank .which further supply water to the main distribution network by action of gravity. 3.6 Pressure In Distribution System Pressure in distribution system should be in range of 14 to 30 m .If pressure is less then 14m ,contaminates from nearby ditches can be drawn into the water system. 3.7 Hydraulics Of Water Distribution Flow unit is LPS Head loss formula H-W=HL=10.68*(Q/C) 1.85*L/d4.87 Q= Average design flow in m3/sec C=Roughness coefficient (For GI pipe) 4
L=Length of pipe in m D=Diameter of pipe in m Q=Av A=Area of pipe V=velocity
4. DESIGN CRITERIA USED IN PROJECT 4.1 Design Period Design period mean the number of future years up to which the present facility would meet the demand. Selection of an appropriate Design period for a particular facility depends upon following factors.
Length or life of structure
Ease of extension First cost Rate of interest (design period is shorter)
Economy of scale Lead time By keeping in view of these factors design period in given case study is 20 years. 4.2 Population Estimation In the given case we assume that total 8 number of people living per house. Total number of population per Flat is 500 & 700 people living per Apartment. Total estimation population for next 20 years.
Population of plots=total number of plots*number of people per house = (8*281)=2248
Population of apartment=total number of apartments*number of people reside per apt. = (700*3) =2100
5
Population of flat =total number of flats * number of people reside per flat= (500*3) =1500
Total est. population =2248+1500+2100=5848
4.3 Per Capita Consumption: Per capita water consumption assumed= (250+17) =267 Design flow=5848*267=1561416 lit/day (18.07 lit/sec)
5. CALCULATION 5.1 Design of Pump Head Formula Design Head =Depth of Water +Losses in pipe +safe head+ Draw down of tube well +Difference in elevation between O.H.T & Reservoir + Height of O.H.T Given values: Draw down of tube well =30’=30*0.304=9.144 m Difference in elevation between O.H.T & Reservoir = 0 (assumed) Height of O.H.T =20m Safe head=10’=10*0.304=3.048m Depth of water=100’=30.4 Losses in pipe =? Now, we find losses in the pipe from reservoir to O.H.T Formula used: HL=10.68(Q/C) ^1.85*L/d^4.87 Q=18.07 lit/sec =18.07/1000=0.01807 m3/sec Sum of the length of all the pipes =1915m Roughness coefficient C=120 6
Diameter=300mm=0.3m Solution=HL=10.68*(0.01807/120) 1.85*1915/ (0.3) 4.87=0.6111m Design head for pump =30.1+9.144+0.6111+3.04+20=62.8951m 5.2 Storage Tank Storage tank is design to meet the maximum daily demand
5.3 Pipe Losses
HL=10.68*(Q/C) 1.85*L/d4.87
Total losses =0.6111m
Q=Av
5.4 Pump Used MB series of CG Centrifugal Monoset Pumps are used .Pumps consist of dynamically balanced rotors and impellers which ensure vibration free operation and enhance life. Features:
Uni-casing construction Separate base plate and coupling / coupling guard not required Flat performance curves at high delivery rates, to prevent motor overloading even during prolonged use Good Suction capacities at both low and high delivery rates Suitable for horizontal mounting with top central discharge Reduced numbers of parts with space saving innovative construction
Standard Specifications:
Range: 3ph - 0.75 kW to 22.5 kW (1HP to 30.0 HP) Supply: 415 V, 50Hz, 3 phase AC Pipe size: 40 x 32 mm to 100 x 100 mm Total head: Upto 75 Meters Capacity: Upto 2140 LPM
7
Liquid: Clear Water Rotation: Clockwise as viewed from motor end Electric Motor TEFC, SCR, 2 or 4 Pole (3000 or 1500 RPM Syn. Speed) Electric Motor for 415V, 50Hz, 3 phase AC supply Applications: Domestic water supply Public water supply schemes
8
6. RESULTS 6.1 Attachment of Map
9
10
6.2: Map Showing Different Parameters At The Nodes And Links
11
6.3: Table For Calculation Of Base Demand
TABLE FOR CALCULATION OF NODAL DEMAND NODE No.
Plots
Flats
Apartments
Tot pop.
Average Demand( l/d)
Av. demand(l/s)
Max.deman d(l/s)
(Tot.pop *(250*17 )*
(Aveargede mand l/d/86400)
(Average demand *1.5)
Peak Hour demand( l/s) (Average demand *2.25)
Total Pop.
N o
Pop.
No
Pop.
N1
N. of plo ts 0
0
0
0
1
700
700
186900
2.16
3.245
4.87
N2
35
280
0
0
0
0
280
74760
0.87
1.298
1.95
N3
0
0
0
0
1
700
700
186900
2.16
3.245
4.87
N4
18
144
0
0
0
0
144
38448
0.45
0.668
1.00
N5
15
120
0
0
0
0
120
32040
0.37
0.556
0.83
N6
11
88
0
0
0
0
88
23496
0.27
0.408
0.61
N7
11
88
0
0
0
0
88
23496
0.27
0.408
0.61
N8
11
88
0
0
0
0
88
23496
0.27
0.408
0.61
N9
13
104
0
0
0
0
104
27768
0.32
0.482
0.72
N10
13
104
250
0
0
354
94518
1.09
1.641
2.46
N11
17
136
0. 5 0
0
0
0
136
36312
0.42
0.630
0.95
N12
15
120
250
0
0
370
98790
1.14
1.715
2.57
N13
15
120
0. 5 0
0
0
0
120
32040
0.37
0.556
0.83
N14
0
0
1
500
0
0
500
133500
1.55
2.318
3.48
N15
27
216
0
0
0
0
216
57672
0.67
1.001
1.50
N16
0
0
1
500
0
0
500
133500
1.55
2.318
3.48
N17
23
184
0
0
0
0
184
49128
0.57
0.853
1.28
N18
11
88
0
0
0
0
88
23496
0.27
0.408
0.61
N19
14
112
0
0
300
412
110004
1.27
1.910
2.86
N20
0
0
0
0
400
400
106800
1.24
1.854
2.78
N21
10
80
0
0
AP(3 ) AP(3 ) 0
0
80
21360
0.25
0.371
0.56
N22
22
176
0
0
0
0
176
46992
0.54
0.816
1.22
TOTAL
28 1
2248
3
1500
3
2100
5848
1561416
18.07
27.108
40.66
lit/d ay
(18.0 7 Lit/S ec)
*Avera ge design flow =
5848*(250 +17)
15614 16
12
6.4: Representation Of Results in table form output files (EPA.NET) Page 1 10/31/2013 6:36:05 PM ********************************************************************** * E P A N E T * * Hydraulic and Water Quality * * Analysis for Pipe Networks * * Version 2.0 * ********************************************************************** Input File: epanet.net
Link - Node Table: ---------------------------------------------------------------------Link Start End Length Diameter ID Node Node m mm ---------------------------------------------------------------------PI1 JU1 JU2 164 80 PI2 JU2 JU3 61 80 PI3 JU3 JU4 86 100 PI4 JU4 JU5 22 150 PI5 JU5 JU6 35 100 PI6 JU6 JU7 100 80 PI7 JU6 JU8 40 100 PI8 JU8 JU9 100 80 PI9 JU8 JU10 35 100 PI10 JU10 JU11 100 80 PI11 JU10 JU12 40 80 PI12 JU12 JU13 110 100 PI13 JU13 JU5 40 150 PI16 JU13 JU15 35 150 PI18 JU15 JU14 110 100 PI19 JU14 JU12 35 80 PI20 JU14 JU16 47 80 PI22 JU16 JU17 110 100 PI23 JU17 JU15 47 150 PI24 JU16 JU18 53 80 PI25 JU17 JU19 55 150 PI26 JU19 JU18 110 100 PI27 JU19 JU20 43 150 PI28 JU20 JU21 40 100 PI29 JU22 JU13 40 100 PI30 JU22 JU21 180 100 PI31 JU22 JU2 58 100 PI32 JU23 TK1 18 300 PI33 TK1 JU15 24 300 PI34 JU23 JU15 20 300 PU1 RS1 JU23 #N/A #N/A Pump
13
Page 2 Energy Usage: ---------------------------------------------------------------------Usage Avg. Kw-hr Avg. Peak Cost Pump Factor Effic. /m3 Kw Kw /day ---------------------------------------------------------------------PU1 100.00 60.00 0.31 16.95 16.95 7324.15 ---------------------------------------------------------------------Demand Charge: 0.00 Total Cost: 7324.15 Node Results: ---------------------------------------------------------------------Node Demand Head Pressure Quality ID LPS m m ---------------------------------------------------------------------JU1 2.16 280.10 29.10 0.00 JU2 0.86 280.72 29.72 0.00 JU3 2.16 280.73 29.73 0.00 JU4 0.44 280.87 29.87 0.00 JU5 0.37 280.87 29.87 0.00 JU6 0.27 280.84 29.84 0.00 JU7 0.27 280.84 29.84 0.00 JU8 0.27 280.83 29.83 0.00 JU9 0.32 280.82 29.82 0.00 JU10 1.09 280.82 29.82 0.00 JU11 0.42 280.80 29.80 0.00 JU12 1.14 280.85 29.85 0.00 JU13 0.37 280.91 29.91 0.00 JU15 0.66 281.00 30.00 0.00 JU14 1.54 280.87 29.87 0.00 JU16 1.54 280.88 29.88 0.00 JU17 0.56 280.94 29.94 0.00 JU18 0.27 280.89 29.89 0.00 JU19 1.27 280.90 29.90 0.00 JU20 1.23 280.90 29.90 0.00 JU21 0.24 280.88 29.88 0.00 JU22 0.54 280.84 29.84 0.00 JU23 0.00 281.00 30.00 0.00 RS1 -15.04 212.00 0.00 0.00 Reservoir TK1 -2.95 281.00 10.00 0.00 Tank Link Results: ---------------------------------------------------------------------Link Flow VelocityUnit Headloss Status ID LPS m/s m/km ---------------------------------------------------------------------PI1 -2.16 0.43 3.84 Open PI2 -0.27 0.05 0.08 Open PI3 -2.43 0.31 1.61 Open PI4 -2.87 0.16 0.30 Open PI5 1.74 0.22 0.86 Open PI6 0.27 0.05 0.08 Open
14
Page 3 Link Results: (continued) ---------------------------------------------------------------------Link Flow Velocity Unit Head loss Status ID LPS m/s m/km ---------------------------------------------------------------------PI7 1.20 0.15 0.43 Open PI8 0.32 0.06 0.11 Open PI9 0.61 0.08 0.12 Open PI10 0.42 0.08 0.18 Open PI11 -0.90 0.18 0.77 Open PI12 -1.29 0.16 0.50 Open PI13 4.97 0.28 0.84 Open PI16 -9.10 0.51 2.58 Open PI18 2.02 0.26 1.14 Open PI19 0.75 0.15 0.55 Open PI20 -0.27 0.05 0.08 Open PI22 -1.38 0.18 0.57 Open PI23 -6.21 0.35 1.27 Open PI24 -0.43 0.09 0.19 Open PI25 4.26 0.24 0.63 Open PI26 0.70 0.09 0.16 Open PI27 2.30 0.13 0.20 Open PI28 1.07 0.14 0.35 Open PI29 -2.47 0.31 1.65 Open PI30 -0.83 0.11 0.22 Open PI31 2.75 0.35 2.02 Open PI32 4.94 0.07 0.03 Open PI33 7.89 0.11 0.07 Open PI34 10.10 0.14 0.11 Open PU1 15.04 0.00 -69.00 Open Pump
15
7: RECOMMENDAIONS & SUGGESTION
Installation of a purification plant at OHT .After some year water to the houses is not suitable for drinking purpose.
To check the decrease in pressure because of the forceful.
Analysis of further requirement of strengthening of the network i.e. distribution system for any specific land use or any area.
The study of revenue generation by metering the entire consumer.
16
REFERENCES
http://www.indiamart.com/precisionengineers/water-pumps.html
http://www.academia.edu/1860889/WATER_DEMAND_ANALYSIS_OF_MUN ICIPAL_WATER_SUPPLY_USING_EPANET_SOFTWARE
17
18
Related Documents 171j1w

Epanet Report 2u5b2j
December 2019 57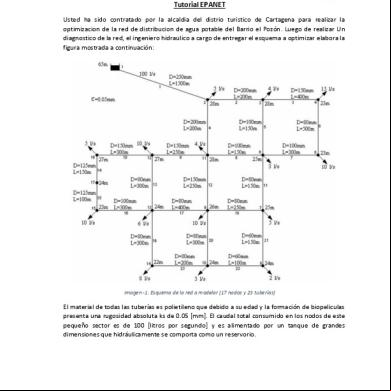
Tutorial Epanet 1lx35
December 2019 59
Manuel Epanet 491n33
July 2022 0
Epanet-2 11625y
January 2023 0
Manual Epanet 5p5g63
November 2019 137
Epanet Z 4t2r2b
December 2019 77More Documents from "Ain Alf" 283zy
Epanet Report 2u5b2j
December 2019 57
Tema 5 Alejandra Mendieta 6c446l
February 2021 0
I Successi Di Renato Carosone 2721d
April 2020 53
373706263 4878862 Home By Andrew York Finger Style Guitar 5q6n2j
April 2020 68
Omstart-unit13 5g6m6e
July 2020 0