Airline Industry Profile 4d3j5y
This document was ed by and they confirmed that they have the permission to share it. If you are author or own the copyright of this book, please report to us by using this report form. Report r6l17
Overview 4q3b3c
& View Airline Industry Profile as PDF for free.
More details 26j3b
- Words: 8,333
- Pages: 42
INDUSTRY PROFILE
Global Airlines Reference Code: 0199-0756 Publication Date: December 2011
www.datamonitor.com Datamonitor USA 245 Fifth Avenue 4th Floor New York, NY 10016 USA t: +1 212 686 7400 f: +1 212 686 2626 e: [email protected]
Datamonitor Europe 119 Farringdon Road London EC1R 3DA United Kingdom t: +44 20 7551 9000 f: +44 20 7675 7500 e: [email protected]
Global - Airlines © Datamonitor. This profile is a licensed product and is not to be photocopied
Datamonitor Middle East and North Africa Datamonitor PO Box 24893 Dubai, UAE
Datamonitor Asia Pacific Level 46, 2 Park Street Sydney, NSW 2000 Australia
t: +49 69 9754 4517 f: +49 69 9754 4900 e: datamonitormena@ datamonitor.com
t: +61 2 8705 6900 f: +61 2 8705 6901 e: [email protected]
0199 - 0756 - 2010 Page 1
EXECUTIVE SUMMARY
EXECUTIVE SUMMARY Market value The global airlines industry grew by 11.9% in 2010 to reach a value of $501.2 billion.
Market value forecast In 2015, the global airlines industry is forecast to have a value of $713.6 billion, an increase of 42.4% since 2010.
Market volume The global airlines industry grew by 5.7% in 2010 to reach a volume of 2,373.1 million engers.
Market volume forecast In 2015, the global airlines industry is forecast to have a volume of 3,046.4 million engers, an increase of 28.4% since 2010.
Market segmentation I Domestic is the largest segment of the global airlines industry, ing for 64% of the industry's total volume.
Market segmentation Americas s for 44.4% of the global airlines industry value.
Market rivalry Rivalry in the global airlines industry is strong, due in part to the sheer size of competitors and the difficulties in exiting the industry.
Global - Airlines © Datamonitor. This profile is a licensed product and is not to be photocopied
0199 - 0756 - 2010 Page 2
CONTENTS
TABLE OF CONTENTS EXECUTIVE SUMMARY
2
MARKET OVERVIEW
7
Market definition
7
Research highlights
8
Market analysis
9
MARKET VALUE
10
MARKET VOLUME
10
MARKET SEGMENTATION I
12
MARKET SEGMENTATION II
13
FIVE FORCES ANALYSIS
13
Summary
14
Buyer power
15
Supplier power
16
New entrants
18
Substitutes
20
Rivalry
22
LEADING COMPANIES
24
Air KLM
24
British Airways Plc
28
Deutsche Lufthansa
32
MARKET FORECASTS
36
Market value forecast
36
Market volume forecast
36
APPENDIX
38
Methodology
38
Industry associations
39
Related Datamonitor research
39
Disclaimer
40
Global - Airlines © Datamonitor. This profile is a licensed product and is not to be photocopied
0199 - 0756 - 2010 Page 3
CONTENTS
ABOUT DATAMONITOR
41
Reports
41
Summary Reports
41
Datamonitor consulting
41
Global - Airlines © Datamonitor. This profile is a licensed product and is not to be photocopied
0199 - 0756 - 2010 Page 4
CONTENTS
LIST OF TABLES Table 1:
Global airlines industry value: $ billion, 2006–10
10
Table 2:
Global airlines industry volume: million engers, 2006–10
11
Table 3:
Global airlines industry segmentation I:% share, by volume, 2010
12
Table 4:
Global airlines industry segmentation: % share, by value, 2010
13
Table 5:
Air KLM: key facts
24
Table 6:
Air KLM: key financials ($)
26
Table 7:
Air KLM: key financials (€)
26
Table 8:
Air KLM: key financial ratios
26
Table 9:
British Airways Plc: key facts
28
Table 10:
British Airways Plc: key financials ($)
29
Table 11:
British Airways Plc: key financials (£)
29
Table 12:
British Airways Plc: key financial ratios
30
Table 13:
Deutsche Lufthansa: key facts
32
Table 14:
Deutsche Lufthansa: key financials ($)
33
Table 15:
Deutsche Lufthansa: key financials (€)
34
Table 16:
Deutsche Lufthansa: key financial ratios
34
Table 17:
Global airlines industry value forecast: $ billion, 2010–15
36
Table 18:
Global airlines industry volume forecast: million engers, 2010–15
37
Global - Airlines © Datamonitor. This profile is a licensed product and is not to be photocopied
0199 - 0756 - 2010 Page 5
CONTENTS
LIST OF FIGURES Figure 1:
Global airlines industry value: $ billion, 2006–10
10
Figure 2:
Global airlines industry volume: million engers, 2006–10
11
Figure 3:
Global airlines industry segmentation I:% share, by volume, 2010
12
Figure 4:
Global airlines industry segmentation: % share, by value, 2010
13
Figure 5:
Forces driving competition in the global airlines industry, 2010
14
Figure 6:
Drivers of buyer power in the global airlines industry, 2010
15
Figure 7:
Drivers of supplier power in the global airlines industry, 2010
16
Figure 8:
Factors influencing the likelihood of new entrants in the global airlines industry, 2010
18
Figure 9:
Factors influencing the threat of substitutes in the global airlines industry, 2010
20
Figure 10:
Drivers of degree of rivalry in the global airlines industry, 2010
22
Figure 11:
Air KLM: revenues & profitability
27
Figure 12:
Air KLM: assets & liabilities
27
Figure 13:
British Airways Plc: revenues & profitability
30
Figure 14:
British Airways Plc: assets & liabilities
31
Figure 15:
Deutsche Lufthansa: revenues & profitability
35
Figure 16:
Deutsche Lufthansa: assets & liabilities
35
Figure 17:
Global airlines industry value forecast: $ billion, 2010–15
36
Figure 18:
Global airlines industry volume forecast: million engers, 2010–15
37
Global - Airlines © Datamonitor. This profile is a licensed product and is not to be photocopied
0199 - 0756 - 2010 Page 6
MARKET OVERVIEW
MARKET OVERVIEW Market definition The airlines industry comprises enger air transportation, including both scheduled and chartered, but excludes air freight transport. Industry volumes are defined as the total number of revenue engers enplaned (departures) at all airports within the country or region, excluding transit engers who arrive and depart on the same flight code. For the US and Canada, transborder engers departing from either country are considered as part of the international segment. Industry value is defined as the total revenue obtained by airlines from transporting these engers. This avoids the double-counting of engers. All currency conversions in this profile were carried out using constant 2010 average annual exchange rates. For the purposes of this report, the global market consists of North America, South America, Western Europe, Eastern Europe, MEA, and Asia-Pacific. North America consists of Canada, Mexico, and the United States. South America comprises Argentina, Brazil, Chile, Colombia, and Venezuela. Western Europe comprises Belgium, Denmark, , , Greece, Italy, the Netherlands, Norway, Spain, Sweden, Switzerland, Turkey, and the United Kingdom. Eastern Europe comprises the Czech Republic, Hungary, Poland, Romania, Russia, and Ukraine. Asia-Pacific comprises Australia, China, India, Indonesia, Japan, New Zealand, Singapore, South Korea, Taiwan, and Thailand. Middle East-Africa (MEA) comprises Egypt, Israel, Nigeria, Saudi Arabia, South Africa, and United Arab Emirates.
Global - Airlines © Datamonitor. This profile is a licensed product and is not to be photocopied
0199 - 0756 - 2010 Page 7
MARKET OVERVIEW
Research highlights The global airlines industry had total revenue of $501.2 billion in 2010, representing a compound annual growth rate (CAGR) of 4.2% between 2006 and 2010. Industry volumes increased with a CAGR of 2.6% between 2006-2010, to reach a total of 2,373.1 million engers in 2010. The performance of the industry is forecast to accelerate, with an anticipated CAGR of 7.3% for the fiveyear period 2010 - 2015, which is expected to drive the industry to a value of $713.6 billion by the end of 2015.
Global - Airlines © Datamonitor. This profile is a licensed product and is not to be photocopied
0199 - 0756 - 2010 Page 8
MARKET OVERVIEW
Market analysis The moderate annualized growth figures for the global airline market 2007-2010 masks a more volatile yearly performance, with strong growth in value up to 2008 followed by a sharp decline in 2009, then recovery in 2010. The global airlines industry had total revenue of $501.2 billion in 2010, representing a compound annual growth rate (CAGR) of 4.2% between 2006 and 2010. In comparison, the European and Asia-Pacific industries grew with CAGRs of 5% and 3.3% respectively, over the same period, to reach respective values of $165.9 billion and $89 billion in 2010. Industry volumes increased with a CAGR of 2.6% between 2006-2010, to reach a total of 2,373.1 million engers in 2010. The industry's volume is expected to rise to 3,046.4 million engers by the end of 2015, representing a CAGR of 5.1% for the 2010-2015 period. Domestic sales had the highest volume in the global airlines industry in 2010, with total sales of 1,518.3 million engers, equivalent to 64% of the industry's overall volume. In comparison, sales of International had a volume of 854.9 million engers in 2010, equating to 36% of the industry total. The performance of the industry is forecast to accelerate, with an anticipated CAGR of 7.3% for the fiveyear period 2010 - 2015, which is expected to drive the industry to a value of $713.6 billion by the end of 2015. Comparatively, the European and Asia-Pacific industries will grow with CAGRs of 8.6% and 7.2% respectively, over the same period, to reach respective values of $251.1 billion and $126.1 billion in 2015.
Global - Airlines © Datamonitor. This profile is a licensed product and is not to be photocopied
0199 - 0756 - 2010 Page 9
MARKET OVERVIEW
MARKET VALUE The global airlines industry grew by 11.9% in 2010 to reach a value of $501.2 billion. The compound annual growth rate of the industry in the period 2006–10 was 4.2%. Table 1:
Global airlines industry value: $ billion, 2006–10
Year
$ billion
€ billion
% Growth
2006 2007 2008 2009 2010
424.5 471.1 522.7 447.8 501.2
319.7 354.8 393.6 337.2 377.4
11.0% 10.9% (14.3%) 11.9%
CAGR: 2006–10 Source: Datamonitor
Figure 1:
4.2% DATAMONITOR
Global airlines industry value: $ billion, 2006–10
Source: Datamonitor
Global - Airlines © Datamonitor. This profile is a licensed product and is not to be photocopied
DATAMONITOR
0199 - 0756 - 2010 Page 10
MARKET VOLUME
MARKET VOLUME The global airlines industry grew by 5.7% in 2010 to reach a volume of 2,373.1 million engers. The compound annual growth rate of the industry in the period 2006–10 was 2.6%. Table 2:
Global airlines industry volume: million engers, 2006–10
Year
million engers
% Growth
2006 2007 2008 2009 2010
2,144.9 2,283.5 2,277.1 2,244.7 2,373.1
6.5% (0.3%) (1.4%) 5.7%
CAGR: 2006–10 Source: Datamonitor
Figure 2:
2.6% DATAMONITOR
Global airlines industry volume: million engers, 2006–10
Source: Datamonitor
Global - Airlines © Datamonitor. This profile is a licensed product and is not to be photocopied
DATAMONITOR
0199 - 0756 - 2010 Page 11
MARKET SEGMENTATION I
MARKET SEGMENTATION I Domestic is the largest segment of the global airlines industry, ing for 64% of the industry's total volume. The international segment s for the remaining 36% of the industry. Table 3:
Global airlines industry segmentation I:% share, by volume, 2010
Category Domestic International Total
100%
Source: Datamonitor
Figure 3:
% Share 64.0% 36.0%
DATAMONITOR
Global airlines industry segmentation I:% share, by volume, 2010
Source: Datamonitor
Global - Airlines © Datamonitor. This profile is a licensed product and is not to be photocopied
DATAMONITOR
0199 - 0756 - 2010 Page 12
MARKET SEGMENTATION I
MARKET SEGMENTATION II Americas s for 44.4% of the global airlines industry value. Europe s for a further 33.1% of the global industry. Table 4:
Global airlines industry segmentation: % share, by value, 2010
Category Americas Europe Asia-Pacific Middle East & Africa Total
100%
Source: Datamonitor
Figure 4:
% Share 44.4 33.1 17.8 4.7
DATAMONITOR
Global airlines industry segmentation: % share, by value, 2010
Source: Datamonitor
Global - Airlines © Datamonitor. This profile is a licensed product and is not to be photocopied
DATAMONITOR
0199 - 0756 - 2010 Page 13
FIVE FORCES ANALYSIS
FIVE FORCES ANALYSIS The airlines market will be analyzed taking airline companies as players. The key buyers will be taken as leisure and business travelers, the latter considered as business-to-business (b2b), and fuel suppliers, aircraft manufacturers, and skilled employees as the key suppliers.
Summary Figure 5:
Forces driving competition in the global airlines industry, 2010
Source: Datamonitor
DATAMONITOR
Rivalry in the global airlines industry is strong, due in part to the sheer size of competitors and the difficulties in exiting the industry. Despite the large number of buyers, their power is strengthened by high price sensitivity as product differentiation tends to be minimal, with negligible switching costs. Budget airlines can compete intensely on price with the legacy carriers. Supplier power is strong as airlines must enter into contracts with aircraft suppliers. Boeing and Airbus dominate the jetliner market; the relative lack of alternatives increases their power. Changing fuel prices could make it difficult to maintain margins and discourage new players to enter the market. Strong rivalry results from factors such as low switching costs for buyers, and a focus on enger transport that leaves carriers vulnerable to declines in demand in an industry that is highly sensitive to the state of the wider economy.
Global - Airlines © Datamonitor. This profile is a licensed product and is not to be photocopied
0199 - 0756 - 2010 Page 14
FIVE FORCES ANALYSIS
Buyer power Figure 6:
Drivers of buyer power in the global airlines industry, 2010
Source: Datamonitor
DATAMONITOR
Airlines generally have a large number of buyers. Many of these are individual consumers purchasing flights directly from the airline, although there are B2B sales to charter companies, discounters, and similar buyers. Price sensitivity is high; a result of factors such as the growth of online price comparison sites, corporate travel expense policies for business flyers, and, for the legacy airlines like British Airways, Lufthansa, and Cathay Pacific competition from low-cost carriers such as Ryanair and Jetstar. This tends to strengthen buyer power in the airlines market. However, airlines can defend themselves against this by differentiating their service in several ways. A common strategy for easing price competition is to focus on the additional features available on higher-priced flights, such as extra leg room, in-flight entertainment, and so on. The inherent switching costs for buyers in the airline market are negligible, which strengthens buyer power. In response, airlines often use loyalty schemes. BA Miles are offered to flyers with BA and can also be gained through purchases of goods and services, such as hotel stays, from partner companies; they can be redeemed for free flights and other incentives. United Airlines has Mileage Plus, and Japanese carrier JAL has Mileage Bank. The air miles lost should a buyer choose to travel with another airline can be viewed as a switching cost. Where the buyers are individual travelers, whether leisure or business, there is no opportunity for them to integrate backwards or for the airlines to integrate forwards; however, vertical integration is more feasible between airlines and companies such as travel agents. Overall, buyer power is moderate.
Global - Airlines © Datamonitor. This profile is a licensed product and is not to be photocopied
0199 - 0756 - 2010 Page 15
FIVE FORCES ANALYSIS
Supplier power Figure 7:
Drivers of supplier power in the global airlines industry, 2010
Source: Datamonitor
DATAMONITOR
Airlines must enter into contracts when buying or leasing aircraft from suppliers. Breaking these contracts can often imply a heavy financial cost. Furthermore, Boeing and Airbus effectively form a duopoly of suppliers of new jetliners, especially in the large jetliner category, with planes such as the 747 and A380. In the market for lower-capacity regional jets and propeller-driven aircraft, companies such as Embraer, ATR, and Bombadier are significant suppliers. The relative lack of alternative manufacturers or substitute inputs increases supplier power. In an industry where reliability and safety are critical, the quality of the planes and their maintenance are highly important; another factor that boosts supplier power. Staffing costs for an airline are substantial, with large numbers of flight and ground personnel, including mechanics, reservation and transportation ticket agents required for an efficient service. Aviation fuel is another vital input. International Air Transport Association (IATA) data indicates that for the global industry, the high price of crude oil and its derivatives in 2008 meant that fuel ed for 33% of total airline costs, compared to less than 18% before 2005. The IATA estimates fuel costs to now represent 29% of the total operating costs in 2011, up from 26% in 2010. Relatively few companies supply aviation fuel, strengthening supplier power, although airlines generally defend against price rises using hedging strategies. Supplier power is restricted by the improbability of these suppliers integrating forwards into the airline business. In addition, although a company like Boeing has alternative sources of revenue, notably defense aerospace, civil aviation remains a very significant part of its business. In 2010, Boeing generated around 50% of total revenues from its global commercial airplanes division.
Global - Airlines © Datamonitor. This profile is a licensed product and is not to be photocopied
0199 - 0756 - 2010 Page 16
FIVE FORCES ANALYSIS
Airbus itself is dominated by its enger jetliner business, although parent company EADS is more diversified, with space, helicopter, and defense divisions. If a supplier lacks diversity, it is more dependent on airlines as customers, weakening its supplier power. Commonly, airlines are forming alliances with one another, not only to achieve network size economies through code sharing, but also to achieve scale economies in the purchase of fuel, and even of aircraft. Combining forces to make purchases serves to increase the industry players' bargaining power and therefore reduce supplier power. It is currently virtually impossible to find substitutes for the inputs required for airlines to operate – an airline must have aircraft, a supply of aviation fuel and a sufficient workforce before it can offer flights. Unlike other modes of transport, airlines have no alternative source of energy. Overall, supplier power is assessed as strong.
Global - Airlines © Datamonitor. This profile is a licensed product and is not to be photocopied
0199 - 0756 - 2010 Page 17
FIVE FORCES ANALYSIS
New entrants Figure 8:
Factors influencing the likelihood of new entrants in the global airlines industry, 2010
Source: Datamonitor
DATAMONITOR
The economic entrance barriers to the airlines industry are relatively high. For an entirely new company, they include the considerable up-front outlay needed to obtain planes, although this may not be an issue for an existing airline beginning to offer flights to a new country or region. Distribution is not particularly easy, as new players need to establish an online booking system, and relationships with travel agents and other sales intermediaries. It is also vital to obtain airport ‘slots’ for take-off and landing. There has been a growth in air traffic over recent years which mean that congestion at airports in many countries is expected, especially the major hubs. The time slot given to an airline is important, and is something all airlines negotiate with airports. Established airlines will already hold the monopoly over slots at certain airports, making it harder for new airlines to infiltrate. This creates difficulties for a new airline aiming to negotiate prime slots at busy airports and can result in it being restricted to offering flights only at off-peak times, or having to fly to airports further away from popular destinations. This can be a deterrent to new airlines, as customers may seek more convenient alternatives. While there is some debate as to whether traditional scale economies are significant in this industry, it seems likely that being able to offer a wide range of routes is advantageous. The larger airlines achieve this not only through their own fleet, but through code sharing agreements with other carriers in alliances; however, a new entrant will not necessarily be approved for hip. The compound annual growth rate (CAGR) for the 2006-2010 period was a moderate 2.3% and forecast growth is expected to be stronger, which should attract new entrants.
Global - Airlines © Datamonitor. This profile is a licensed product and is not to be photocopied
0199 - 0756 - 2010 Page 18
FIVE FORCES ANALYSIS
However, with changing fuel prices, it may be difficult to maintain margins, thus discouraging new players. Regulation forms an additional barrier. The various national civil aviation authorities in Europe, such as Direction Générale de l’Aviation Civile (DGAC) in and the Federal Aviation Authority in the US, regulate areas such as safety, environmental impact, airspace usage, and enger rights; compliance raises the cost of entry for a new company. For airline markets, there is an additional regulatory issue to consider. Cabotage is the provision of domestic transport services in a country by companies based in a different country. Airline cabotage is generally forbidden, unless explicitly permitted by an agreement between two or more countries. Cabotage by any EU-based carriers is permitted in any other EU-country; also, the Open Skies agreement, finalized in mid-2010, accords cabotage rights to US carriers in the EU. This liberalization should increase the opportunities for market access in this region. However, in other countries, cabotage is generally not possible, and in some cases foreign ownership of domestic airlines is also restricted to a certain percentage. Overall, there is a moderate likelihood of new entrants to this industry.
Global - Airlines © Datamonitor. This profile is a licensed product and is not to be photocopied
0199 - 0756 - 2010 Page 19
FIVE FORCES ANALYSIS
Substitutes Figure 9:
Factors influencing the threat of substitutes in the global airlines industry, 2010
Source: Datamonitor
DATAMONITOR
Other forms of transport such as road, rail and marine travel are considered as substitutes to airline travel. Buyers take into not only the cost of travel but also how long the journey will take on corresponding forms of transportation. In larger countries, air travel makes it easier to overcome long distances and has certain benefits such as shorter travel time than rail travel, even including the time to check in. However in smaller countries, domestic air travel may not be so appropriate, and rail and road transportation become more attractive alternatives. Furthermore, many consumers are now aware of the environmental impact of air travel, and are turning to rail travel instead. It is possible to travel around much of the world by long-distance bus or train, although levels of service vary and some border crossings may present a difficulty. Other than cross-border land transport to Canada and South America, there are few substitutes for international air travel in the US. Its geography isolates it from Europe and Asia-Pacific, and marine enger transportation is essentially restricted to leisure cruises. Domestic flights, which for almost 87.1% of US enger volumes can be substituted by car, bus, or rail. Rail track density is lower in the US than in most major Western European countries. This suggests that rail travel is not as strong a threat to domestic travel in the US as it might be in some comparable countries or regions. Bus travel, however, is popular in the US with Greyhound Lines providing an extensive bus network which links most US cities and also runs services to Canada and Mexico. Fares are considerably lower than both air and train travel, but these services are more time consuming. Most of Europe has well-developed land transport infrastructure.
Global - Airlines © Datamonitor. This profile is a licensed product and is not to be photocopied
0199 - 0756 - 2010 Page 20
FIVE FORCES ANALYSIS
Domestic flights, defined as flights beginning and ending in the same country, for just under onethird of European air enger volumes, and can easily be substituted by car, bus, or rail. Cross-border land transport, including high speed trains in several countries, means that many international flights within Europe can also be substituted. The Channel Tunnel allows Eurostar to operate trains connecting the UK to and beyond. Long distance bus travel is available from companies such as Eurolines, Busabout, and National Express. Eurolines services are focused on international travelers, and connect more than 40 European cities. Fares are considerably lower than both air and train travel, but these services are more time consuming. In Asia-Pacific, domestic flights, which for 77.4% of air enger volumes for the region as a whole, can be substituted by car, bus, or rail. International air travel is generally less vulnerable to road and rail substitution in this region. Japan, Australia, and Taiwan are islands with no links to mainland Asia, and land access from the South Korean peninsula to the rest of the continent is complicated by the need to travel via North Korea. Singapore is connected by a road and rail bridge to Malaysia. Travel from the more developed regions of China to the west is technically possible over land, but the distances make this impractical. In contrast, international land travel in Europe is favored by a dense road and rail infrastructure, and is a more significant substitute to air travel in that region. For business travel, alternatives include ‘virtual meetings’ via videoconferencing and similar technologies. The switching costs here are the cost of the equipment required. At present it is not clear how completely such technologies will replace face-to-face meetings. Overall, the threat from substitutes is assessed as moderate.
Global - Airlines © Datamonitor. This profile is a licensed product and is not to be photocopied
0199 - 0756 - 2010 Page 21
FIVE FORCES ANALYSIS
Rivalry Figure 10: Drivers of degree of rivalry in the global airlines industry, 2010
Source: Datamonitor
DATAMONITOR
The competitive landscape has several large companies, such as, JAL, Air -KLM and British Airways, alongside smaller competitors. Rivalry is increased by the presence of low-cost carriers in the market, as these companies can compete more intensely on price. Switching costs for buyers are low, which means that it is easy for them to change to a competitor. In this market, ‘storage costs’ are actually the costs associated with unsold seats on a flight. Given the cost of fuel, staffing and so on associated with operating a flight, it is important to maximize the number of seats sold, hence the common policy of selling slightly more tickets than there are available seats on the understanding that some buyers will not make their plane. Where storage costs are high, rivalry is intensified. Diversification in the enger airlines industry ranges from moderate to little. Most carriers generate additional revenues through freight, but this is often a small proportion of their total sales. A lack of diversity forces players to compete more intensely in their single core business. Exit costs are moderate. Planes are important assets with a high purchase price, which depreciate in value with time and require frequent maintenance expenses. The difference between the outlay on them and the amount they can be sold for represents a sunk cost for an airline exiting the market. However, they are mobile. If conditions become tough in the airlines market in one country, a carrier that wishes to exit is not obliged to try to sell these assets where other companies are trying to do the same thing. It could sell them in a location where there is high demand for secondhand planes.
Global - Airlines © Datamonitor. This profile is a licensed product and is not to be photocopied
0199 - 0756 - 2010 Page 22
FIVE FORCES ANALYSIS
However, the airline industry is quite labor-intensive; thus large numbers of employees may need to be offered severance pay should a company lay them off on exiting this market. Rivalry in the global airline industry is assessed strong.
Global - Airlines © Datamonitor. This profile is a licensed product and is not to be photocopied
0199 - 0756 - 2010 Page 23
LEADING COMPANIES
LEADING COMPANIES Air KLM Table 5:
Air KLM: key facts
Head office: Telephone: Website: Financial year-end: Ticker: Stock exchange:
45 rue de Paris, 95747 Roissy CDG Cedex, FRA 33 1 41 56 7800 www.airklm-finance.com March AF Paris
Source: company website
DATAMONITOR
Air -KLM (or the group) is a combined entity of two airlines which include Air and KLM Royal Dutch Airlines. The group's main business activity is enger transportation. The groups is also involved in other business activities such as cargo transportation, aeronautics maintenance and overhaul services, and other air-transport related activities, including catering and air transport services. The group has its operations across Europe, North America, South America, Africa, the Asia Pacific and the Middle East. Air -KLM serves 244 destinations in 105 countries world-wide. In FY2010, the group's fleet comprised 625 aircraft, of which 594 were in operation. The main fleet consisted of 168 long-haul aircraft, 26 cargo aircraft and 232 medium-haul aircraft. The regional fleet comprises 199 aircraft. These 168 long-haul aircraft included 13 Boeing 747-400s, 30 Boeing 777-300s, 25 Boeing 777-200s, 18 Airbus 340-300s, 15 Airbus 330-200s, and two Airbus 380-800. In the freighter aircraft portfolio, the group has five Boeing 747-400 cargo aircrafts, four Boeing 747-200 cargo flights, and two Boeing 777-cargo flights. In the medium-haul segment, the group has 61 Airbus 320s, 45 Airbus 319s, 24 Airbus 321s, and 18 Airbus 318s. The group operates its business through four business divisions: enger, cargo, maintenance and other. enger business division's operations primarily include enger transport services, on scheduled flights that have the group's air code. It also operates enger transport services, on scheduled flights which are operated by other airlines under code-sharing agreements. The group primarily operates through six hubs which include Paris, Amsterdam, Atlanta, Detroit, Minneapolis and New York. In FY2010, the group carried 71.4 million engers with a load factor of 80.7%. For the same period the group generated a total of 251 billion available seat kilometers (ASKs) and 202.4 billion revenue enger kilometers (RPKs). Global - Airlines © Datamonitor. This profile is a licensed product and is not to be photocopied
0199 - 0756 - 2010 Page 24
LEADING COMPANIES
The cargo business division is primarily involved in freight transport through its own flights and by other partner airlines under code-sharing agreements. The revenue for this division is also derived from sales of cargo capacity to third parties. In FY2010, the group transported approximately 1.46 million tons of freight with a load factor of 66.5%. For the same period, the group generated total revenue tonne kilometers (RTKs) of 11.2 billion and available tonne kilometers (ATKs) of 16.8 billion. In FY2010, the group carried cargo to 350 destinations in 175 countries. Air -KLM is a founding member of SkyTeam since its inception in 2000. SkyTeam brings together 13 member airlines including Aeroflot, AeroMexico, Air Europa, Air , KLM, Alitalia, China Southern, CSA, Delta Airlines, Kenya Airways, Korean Airlines, Tarom and Vietnam Airlines. The alliance operates in countries world-wide with more than 13,133 daily flights to 898 destinations in 169 countries. In addition, the group is also a member of SkyTeam Cargo. This global alliance dedicated to cargo has seven airline including AeroMexico Cargo, Air Cargo, KLM Cargo, Korean Air Cargo, CSA Cargo, Delta Air Logistics and Korean Air Cargo. SkyTeam Cargo operates cargo services to 728 commercial destinations in 149 countries with more than 15,000 daily flights. In addition, the group also offers a frequent flyer loyalty program named Flying Blue that offers rewards to engers travelling on certain types of tickets on Air -KLM or with other partner companies. Maintenance business division operations include maintenance, repair and overhaul services provided to airlines within the group and other clients around the world. The maintenance activities are known under the Air Industries (AFI) brand and KLM Engineering and Maintenance (KLM E&M). During FY2010, the group worked and maintained over 1,260 aircraft. The principal activities of the maintenance division are aircraft maintenance, component overhaul and engine overhaul. The other division consists primarily of catering supplied by the group to third-party airlines through Servair and leisure activities and charter flights operated primarily by Transavia. Cityjet, a subsidiary of Air , brought Belgian airline VLM in 2007. Key Metrics The company recorded revenues of $27,818 million in the fiscal year ending March 2010, a decrease of 12.4% compared to fiscal 2009. Its net loss was $2,065 million in fiscal 2010, compared to a net loss of $1,078 million in the preceding year.
Global - Airlines © Datamonitor. This profile is a licensed product and is not to be photocopied
0199 - 0756 - 2010 Page 25
LEADING COMPANIES
Table 6:
Air KLM: key financials ($)
$ million Revenues Net income (loss) Total assets Total liabilities Employees
2006
2007
2008
2009
28,417.8 1,209.5 35,077.1 24,674.1 102,422
30,570.4 1,180.3 35,330.1 24,186.6 103,050
31,944.2 990.9 40,655.5 26,595.0 104,659
31,760.0 (1,078.3) 38,116.0 30,668.5 104,721
Source: company filings
Table 7:
DATAMONITOR
Air KLM: key financials (€)
€ million Revenues Net income (loss) Total assets Total liabilities
2006
2007
2008
2009
21,452.0 913.0 26,479.0 18,626.0
23,077.0 891.0 26,670.0 18,258.0
24,114.0 748.0 30,690.0 20,076.0
23,975.0 (814.0) 28,773.0 23,151.0
Source: company filings
Table 8:
2010 27,817.7 (2,065.2) 36,793.9 29,689.5 106,933
2010 20,999.0 (1,559.0) 27,775.0 22,412.0
DATAMONITOR
Air KLM: key financial ratios
Ratio Profit margin Revenue growth Asset growth Liabilities growth Debt/asset ratio Return on assets Revenue per employee Profit per employee
2006
2007
2008
2009
4.3% 13.0% 14.2% 8.5% 70.3% 3.7% $277,458 $11,809
3.9% 7.6% 0.7% (2.0%) 68.5% 3.4% $296,656 $11,454
3.1% 4.5% 15.1% 10.0% 65.4% 2.6% $305,221 $9,468
(3.4%) (0.6%) (6.2%) 15.3% 80.5% (2.7%) $303,282 ($10,297)
Source: company filings
Global - Airlines © Datamonitor. This profile is a licensed product and is not to be photocopied
2010 (7.4%) (12.4%) (3.5%) (3.2%) 80.7% (5.5%) $260,141 ($19,313)
DATAMONITOR
0199 - 0756 - 2010 Page 26
LEADING COMPANIES
Figure 11: Air KLM: revenues & profitability
Source: company filings
DATAMONITOR
Figure 12: Air KLM: assets & liabilities
Source: company filings
Global - Airlines © Datamonitor. This profile is a licensed product and is not to be photocopied
DATAMONITOR
0199 - 0756 - 2010 Page 27
LEADING COMPANIES
British Airways Plc Table 9:
British Airways Plc: key facts
Head office: Telephone: Website: Financial year-end: Ticker:
Waterside, Harmondsworth, UB7 0GB, GBR 44 20 8738 5117 www.britishairways.com BAY London
Source: company website
DATAMONITOR
British Airways is one of the world's leading scheduled international airlines. At the end of March 2009, the company had 241 aircraft in service with 41 on order. The company serves more than 370 destinations worldwide. The company operates through two business divisions: airline and non-airline. The airline business comprises the company's main scheduled enger and cargo operations. The company's enger transportation services include domestic and international air transport, and scheduled as well as chartered services. In FY2009, the company carried more than 33 million engers. The company's principal place of business is Heathrow, one of the world's premier airport locations, which serves a large geographical area with a comparatively high proportion of point-to-point business. In addition, the company has a second base of operations at Gatwick, London. The company operates offices, maintenance hangars, and other facilities at Heathrow, Gatwick and other UK airports. The company also occupies space and desks under lease or license in airports throughout the UK, including: Manchester, Birmingham, Newcastle, Edinburgh and Glasgow. The company carried 777,000 tons of cargo to destinations in Europe, the Americas and throughout the world during FY2009. A majority of the cargo is carried in the holds of enger aircraft, while the balance is carried on leased or part-chartered freighter aircraft, where market conditions allow their deployment. The company also provides a variety of services to other airlines, including: cargo handling at airports; airframe maintenance; computer and communications services; and consultancy services. British Airways has been at the centre of ongoing disputes with employees throughout 2010 as a result of the companies cost cutting measures. Industrial action has taken place on several occasions.
Global - Airlines © Datamonitor. This profile is a licensed product and is not to be photocopied
0199 - 0756 - 2010 Page 28
LEADING COMPANIES
On November 12, 2009, British Airways confirmed that it had reached a preliminary agreement to merge with Spanish airline giant Iberia. The merger between the two carriers is expected to create the world's third-largest airline in of annual revenue and the second largest airline group in Europe. The merger was confirmed on April 8, 2010, and it is expected to be completed by the end of the year under the newly created Anglo-Spanish Holding Company, International Airlines Group. Key Metrics The company recorded revenues of $12,345 million in the fiscal year ending BAY 2010, a decrease of 11.1% compared to fiscal 2009. Its net loss was $656 million in fiscal 2010, compared to a net loss of $553 million in the preceding year.
Table 10:
British Airways Plc: key financials ($)
$ million Revenues Net income (loss) Total assets Total liabilities
2006
2007
2008
2009
13,149.8 721.2 18,800.4 15,866.2
13,114.2 447.8 17,580.4 15,710.2
13,517.3 1,050.1 17,177.3 12,184.6
13,886.4 (552.9) 16,196.7 13,345.9
Source: company filings
Table 11:
2010 12,345.2 (656.3) 19,736.2 9,397.1
DATAMONITOR
British Airways Plc: key financials (£)
£ million Revenues Net income (loss) Total assets Total liabilities
2006
2007
2008
2009
8,515.0 467.0 12,174.0 10,274.0
8,492.0 290.0 11,384.0 10,173.0
8,753.0 680.0 11,123.0 7,890.0
8,992.0 (358.0) 10,488.0 8,642.0
Source: company filings
Global - Airlines © Datamonitor. This profile is a licensed product and is not to be photocopied
2010 7,994.0 (425.0) 12,780.0 6,085.0
DATAMONITOR
0199 - 0756 - 2010 Page 29
LEADING COMPANIES
Table 12:
British Airways Plc: key financial ratios
Ratio Profit margin Revenue growth Asset growth Liabilities growth Debt/asset ratio Return on assets
2006
2007
2008
2009
5.5% 9.6% 4.3% 1.7% 84.4% 3.9%
3.4% (0.3%) (6.5%) (1.0%) 89.4% 2.5%
7.8% 3.1% (2.3%) (22.4%) 70.9% 6.0%
(4.0%) 2.7% (5.7%) 9.5% 82.4% (3.3%)
Source: company filings
2010 (5.3%) (11.1%) 21.9% (29.6%) 47.6% (3.7%)
DATAMONITOR
Figure 13: British Airways Plc: revenues & profitability
Source: company filings
Global - Airlines © Datamonitor. This profile is a licensed product and is not to be photocopied
DATAMONITOR
0199 - 0756 - 2010 Page 30
LEADING COMPANIES
Figure 14: British Airways Plc: assets & liabilities
Source: company filings
Global - Airlines © Datamonitor. This profile is a licensed product and is not to be photocopied
DATAMONITOR
0199 - 0756 - 2010 Page 31
LEADING COMPANIES
Deutsche Lufthansa Table 13:
Deutsche Lufthansa: key facts
Head office: Website: Financial year-end: Ticker: Stock exchange:
Von-Gablenz-Strasse 2-6, 50679 Koln, DEU www.lufthansa.com December LHA Frankfurt
Source: company website
DATAMONITOR
Lufthansa is a German aviation group which operates in several countries. It is also a holding company which has presence in several segments of the aviation sector. Lufthansa operates through 400 subsidiaries and associate companies. Lufthansa is also the single largest operating company in the group and, with the exception of its core business (enger transportation), all the other business segments are operated as separate companies. The company has five business segments: enger airline group; logistics; maintenance repair overhaul (MRO); catering; and IT services. The enger airline group is the largest segment and the core business of Lufthansa; it encomes the services provided by other brands, including SWISS, Germanwings, Austrian Airlines, British Midland Jet Blue and Brussels Airlines. The services are provided through multiple hubs in Frankfurt, Munich, Zurich, Vienna and Brussels. Lufthansa, SWISS, Austrian Airlines, British Midland and Brussels Airlines together serve 254 destinations in 101 countries. The enger airline segment also includes Star Alliance, which is a network of airlines and currently has about 24 member airlines, serving 916 destinations across 160 countries. The segment also actively invests in other airline companies attaining either a majority or minority stake and also undertakes total acquisitions. The logistics segment is operated by Lufthansa Cargo which is a wholly-owned subsidiary of the group and is an airport-to-airport business. The operations of this segment are divided into three air freight products: td.Pro which deals with general cargo; td.Flash for express shipments; and the Specials segment which deals with temperature-sensitive shipments, live animals, airmail and valuable freight. This segment uses its own fleet of freighters as well as the belly capacity of its enger aircraft and road services. The logistics segment serves 300 locations with Frankfurt as its air cargo hub. Lufthansa Technik, a wholly-owned subsidiary of Lufthansa, operates the MRO segment.
Global - Airlines © Datamonitor. This profile is a licensed product and is not to be photocopied
0199 - 0756 - 2010 Page 32
LEADING COMPANIES
The activities of this subsidiary and its 56 subsidiary and associate companies are categorized into six business units: maintenance, overhaul, engine services, component services, landing gear services and completion. The range of services that the segment provides span from repair of individual components to fully integrated maintenance of entire fleets with reserve engines and diverse components. The segment caters to commercial aircraft, their engines and components. Lufthansa Technik's stations are located at all principal German airports and 50 other locations in the world with primary centers located in Hamburg, Frankfurt, Munich and Berlin. The catering segment is operated by LSG Lufthansa Service Holding which offers airline catering as well as in flight service solutions, which include the development, sourcing and logistics of onboard equipment and the management of all processes that take place before, during, and after the onboard service. The segment comprises 129 companies and over 200 facilities across 50 countries. Lufthansa systems, a subsidiary, offers IT solutions to the aviation industry for all business processes like enger and cargo services through to flight operations, and the maintenance and overhaul of aircraft. The segment focuses on integrated platforms with a service portfolio that encomes the entire range of IT services, such as consultancy, the development and implementation of industry solutions, as well as operations of a company's own computer centre. The IT services segment caters to other industries as well and operates in and 16 other countries. Additionally, Lufthansa also provides flight training services and business travel management solutions which specialize in dealing with corporate travel. Key Metrics The company recorded revenues of $29,499 million in the fiscal year ending December 2010, which was within 0.1% of the revenue in fiscal 2009. Its net income was $1,498 million in fiscal 2010, compared to a net loss of $132 million in the preceding year.
Table 14:
Deutsche Lufthansa: key financials ($)
$ million Revenues Net income (loss) Total assets Total liabilities
2006
2007
2008
2009
26,294.2 1,063.7 25,780.3 19,283.6
29,700.1 2,192.4 29,567.6 20,427.1
32,945.6 806.8 29,684.2 20,518.5
29,518.6 (132.5) 34,961.8 26,746.0
Source: company filings
Global - Airlines © Datamonitor. This profile is a licensed product and is not to be photocopied
2010 29,498.7 1,498.3 38,840.6 27,792.5
DATAMONITOR
0199 - 0756 - 2010 Page 33
LEADING COMPANIES
Table 15:
Deutsche Lufthansa: key financials (€)
€ million Revenues Net income (loss) Total assets Total liabilities
2006
2007
2008
2009
19,849.0 803.0 19,461.0 14,556.8
22,420.0 1,655.0 22,320.0 15,420.0
24,870.0 609.0 22,408.0 15,489.0
22,283.0 (100.0) 26,392.0 20,190.0
Source: company filings
Table 16:
2010 22,268.0 1,131.0 29,320.0 20,980.0
DATAMONITOR
Deutsche Lufthansa: key financial ratios
Ratio Profit margin Revenue growth Asset growth Liabilities growth Debt/asset ratio Return on assets
2006
2007
2008
2009
4.0% 9.9% 1.0% (1.3%) 74.8% 4.1%
7.4% 13.0% 14.7% 5.9% 69.1% 7.9%
2.4% 10.9% 0.4% 0.4% 69.1% 2.7%
(0.4%) (10.4%) 17.8% 30.4% 76.5% (0.4%)
Source: company filings
Global - Airlines © Datamonitor. This profile is a licensed product and is not to be photocopied
2010 5.1% (0.1%) 11.1% 3.9% 71.6% 4.1%
DATAMONITOR
0199 - 0756 - 2010 Page 34
LEADING COMPANIES
Figure 15: Deutsche Lufthansa: revenues & profitability
Source: company filings
DATAMONITOR
Figure 16: Deutsche Lufthansa: assets & liabilities
Source: company filings
Global - Airlines © Datamonitor. This profile is a licensed product and is not to be photocopied
DATAMONITOR
0199 - 0756 - 2010 Page 35
LEADING COMPANIES
MARKET FORECASTS Market value forecast In 2015, the global airlines industry is forecast to have a value of $713.6 billion, an increase of 42.4% since 2010. The compound annual growth rate of the industry in the period 2010–15 is predicted to be 7.3%. Table 17:
Global airlines industry value forecast: $ billion, 2010–15
Year
$ billion
€ billion
2010 2011 2012 2013 2014 2015
501.2 540.4 574.6 617.9 664.3 713.6
377.4 406.9 432.7 465.3 500.3 537.4
CAGR: 2010–15 Source: Datamonitor
% Growth 11.9% 7.8% 6.3% 7.5% 7.5% 7.4% 7.3% DATAMONITOR
Figure 17: Global airlines industry value forecast: $ billion, 2010–15
Source: Datamonitor
Global - Airlines © Datamonitor. This profile is a licensed product and is not to be photocopied
DATAMONITOR
0199 - 0756 - 2010 Page 36
MARKET FORECASTS
Market volume forecast In 2015, the global airlines industry is forecast to have a volume of 3,046.4 million engers, an increase of 28.4% since 2010. The compound annual growth rate of the industry in the period 2010–15 is predicted to be 5.1%. Table 18:
Global airlines industry volume forecast: million engers, 2010–15
Year
million engers
2010 2011 2012 2013 2014 2015
2,373.1 2,498.6 2,631.4 2,758.1 2,896.3 3,046.4
% Growth 5.7% 5.3% 5.3% 4.8% 5.0% 5.2%
CAGR: 2010–15 Source: Datamonitor
5.1% DATAMONITOR
Figure 18: Global airlines industry volume forecast: million engers, 2010–15
Source: Datamonitor
Global - Airlines © Datamonitor. This profile is a licensed product and is not to be photocopied
DATAMONITOR
0199 - 0756 - 2010 Page 37
APPENDIX
APPENDIX Methodology Datamonitor Industry Profiles draw on extensive primary and secondary research, all aggregated, analyzed, cross-checked and presented in a consistent and accessible style. Review of in-house databases – Created using 250,000+ industry interviews and consumer surveys and ed by analysis from industry experts using highly complex modeling & forecasting tools, Datamonitor’s in-house databases provide the foundation for all related industry profiles Preparatory research – We also maintain extensive in-house databases of news, analyst commentary, company profiles and macroeconomic & demographic information, which enable our researchers to build an accurate market overview Definitions – Market definitions are standardized to allow comparison from country to country. The parameters of each definition are carefully reviewed at the start of the research process to ensure they match the requirements of both the market and our clients Extensive secondary research activities ensure we are always fully up-to-date with the latest industry events and trends Datamonitor aggregates and analyzes a number of secondary information sources, including: -
National/Governmental statistics
-
International data (official international sources)
-
National and International trade associations
-
Broker and analyst reports
-
Company Annual Reports
-
Business information libraries and databases
Modeling & forecasting tools – Datamonitor has developed powerful tools that allow quantitative and qualitative data to be combined with related macroeconomic and demographic drivers to create market models and forecasts, which can then be refined according to specific competitive, regulatory and demand-related factors Continuous quality control ensures that our processes and profiles remain focused, accurate and up-to-date
Global - Airlines © Datamonitor. This profile is a licensed product and is not to be photocopied
0199 - 0756 - 2010 Page 38
APPENDIX
Industry associations International Air Transport Association (IATA) Travel Industry Designator Service, 800 Place Victoria, P.O. Box 113, Montreal, Quebec, H4Z 1M1, Canada Tel.: 1 514 874 0202 Fax: 1 514 874 1753 www.iata.org International Air Carriers Association Rue Montoyer, 23, BE-1000 Brussels Belgium Tel.: 32 2 546 1060 Fax: 32 2 546 1070 www.iaca.be Association of European Airlines Avenue Louise 350, B-1050 Brussels, Belgium Tel.: 32 2 639 8989 Fax: 32 2 639 8999 www.aea.be
Related Datamonitor research Industry Profile Airlines in Europe Airlines in Asia-Pacific Airlines in the United States Airlines in the United Kingdom Airlines in Japan
Global - Airlines © Datamonitor. This profile is a licensed product and is not to be photocopied
0199 - 0756 - 2010 Page 39
APPENDIX
Disclaimer All Rights Reserved. No part of this publication may be reproduced, stored in a retrieval system or transmitted in any form by any means, electronic, mechanical, photocopying, recording or otherwise, without the prior permission of the publisher, Datamonitor plc. The facts of this report are believed to be correct at the time of publication but cannot be guaranteed. Please note that the findings, conclusions and recommendations that Datamonitor delivers will be based on information gathered in good faith from both primary and secondary sources, whose accuracy we are not always in a position to guarantee. As such Datamonitor can accept no liability whatever for actions taken based on any information that may subsequently prove to be incorrect.
Global - Airlines © Datamonitor. This profile is a licensed product and is not to be photocopied
0199 - 0756 - 2010 Page 40
ABOUT DATAMONITOR
ABOUT DATAMONITOR The Datamonitor Group is a world-leading provider of global business information, delivering independent data, analysis and opinion across the Automotive, Consumer Markets, Energy & Utilities, Financial Services, Logistics & Express, Pharmaceutical & Healthcare, Retail, Technology and Telecoms industries. Combining our industry knowledge and experience, we assist over 6,000 of the world’s leading companies in making better strategic and operational decisions. Delivered online via our -friendly web platforms, our market intelligence products and services ensure that you will achieve your desired commercial goals by giving you the insight you need to best respond to your competitive environment.
Reports Datamonitor's reports are based on primary research with industry s and consumers. We gather information on market segmentation, market growth and pricing, competitors and products. Our experts then interpret this data to produce detailed forecasts and actionable recommendations, helping you create new business opportunities and ideas.
Summary Reports Our series of company, industry and country profiles complements our products, providing top-level information on 30,000 companies, 3,000 industries and 100 countries. While they do not contain the highly detailed breakdowns found in reports, profiles give you the most important qualitative and quantitative summary information you need - including predictions and forecasts.
Datamonitor consulting We hope that the data and analysis in this profile will help you make informed and imaginative business decisions. If you have further requirements, Datamonitor’s consulting team may be able to help you. For more information about Datamonitor’s consulting capabilities, please us directly at [email protected].
Global - Airlines © Datamonitor. This profile is a licensed product and is not to be photocopied
0199 - 0756 - 2010 Page 41
Copyright of Airlines Industry Profile: Global is the property of Datamonitor Plc and its content may not be copied or emailed to multiple sites or posted to a listserv without the copyright holder's express written permission. However, s may print, , or email articles for individual use.
Related Documents 171j1w

Airline Industry Profile 4d3j5y
January 2022 0
Airline Industry s4d4k
December 2019 43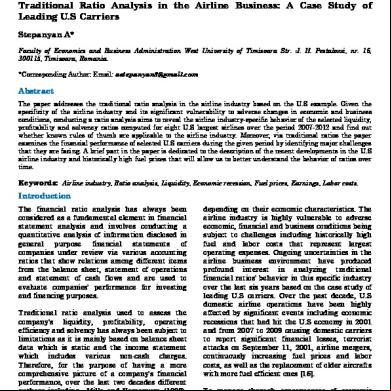
Airline Industry s4d4k
November 2019 39
Airline Industry Analysis 6d534w
November 2019 64
Airline The Service Industry 6n4u2l
October 2019 55